

Question: f3 2 1 0 1 2 3 4 5 6 7 8 9 10 11 12 13 14 Figure B3 2 1 O 1 2
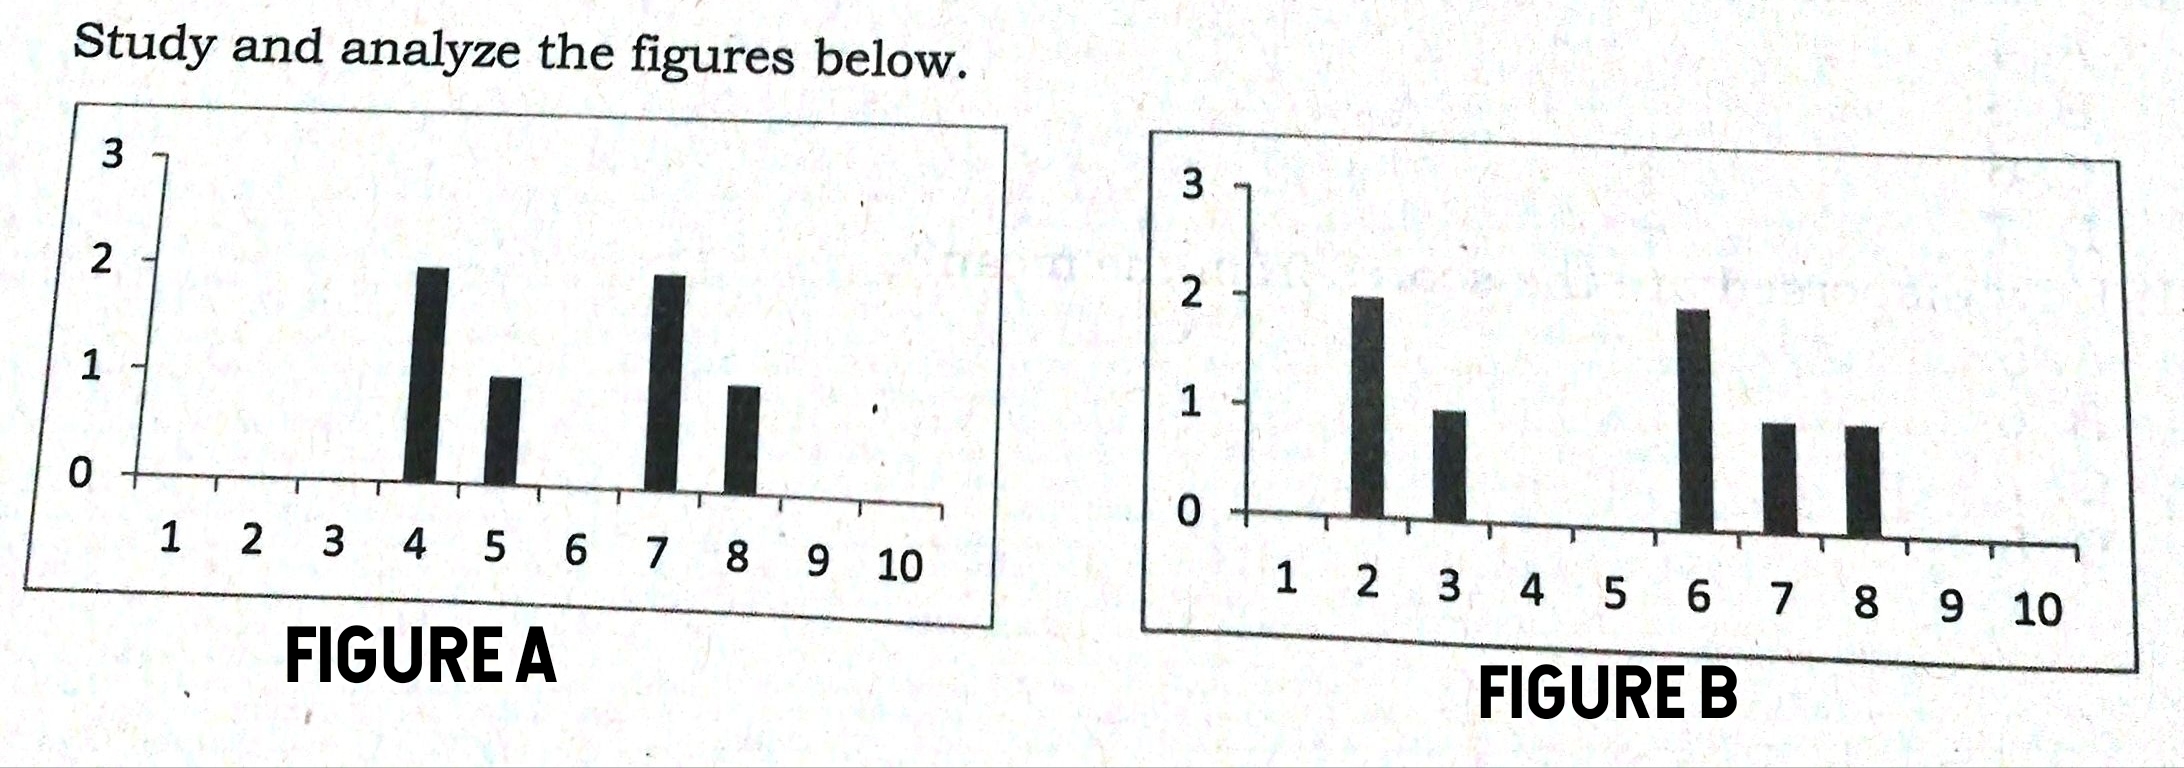
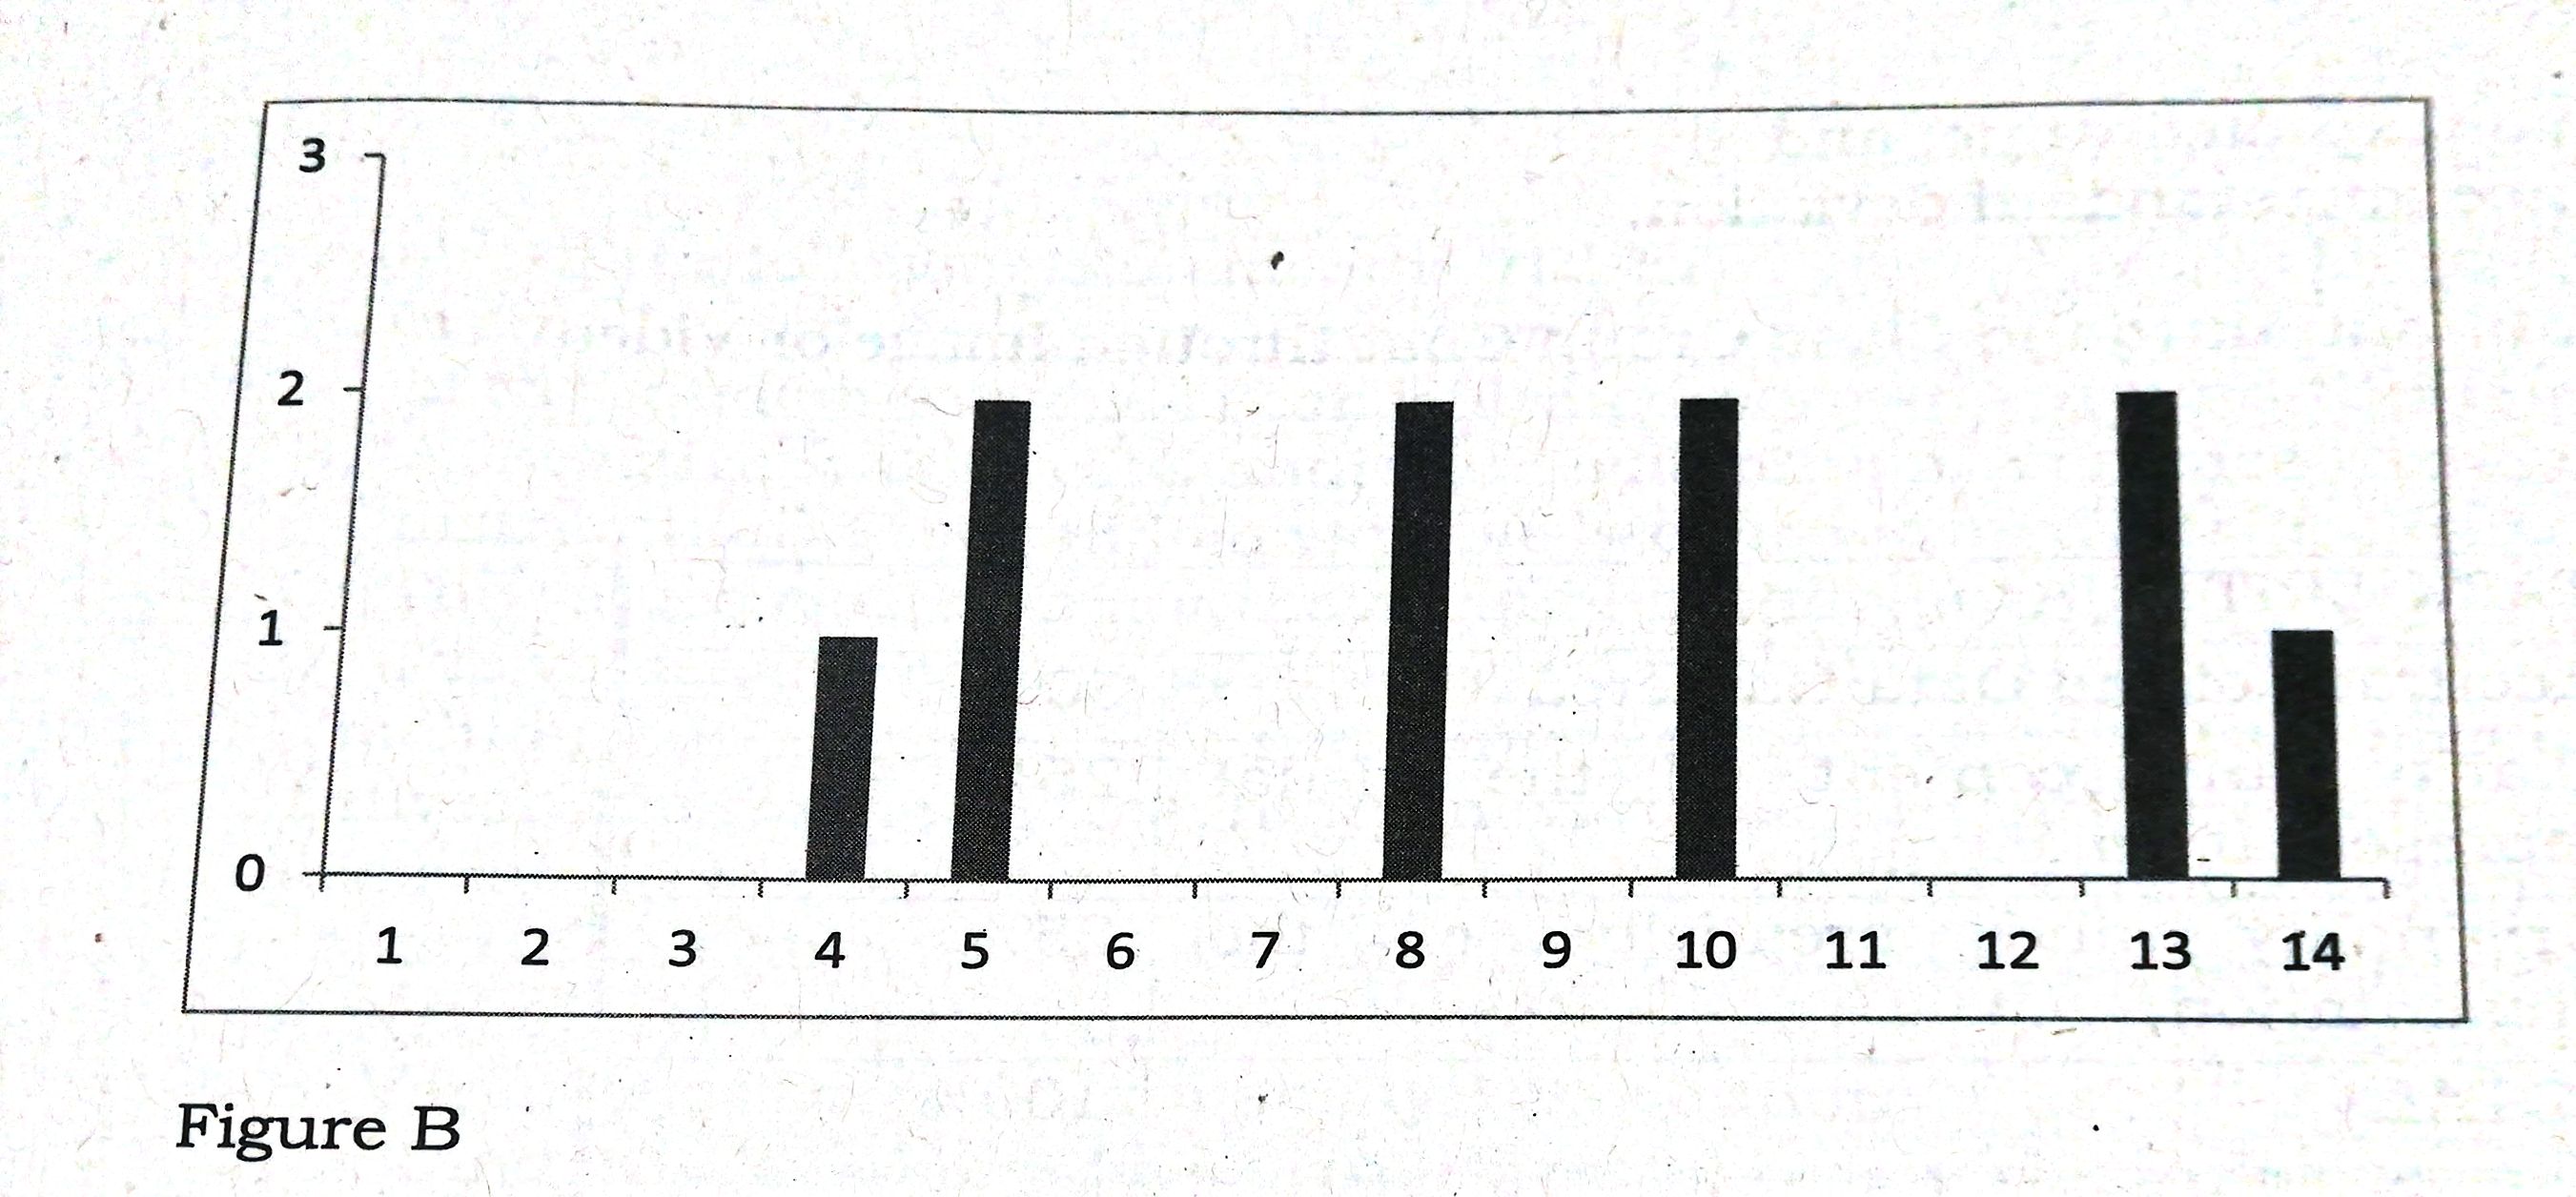
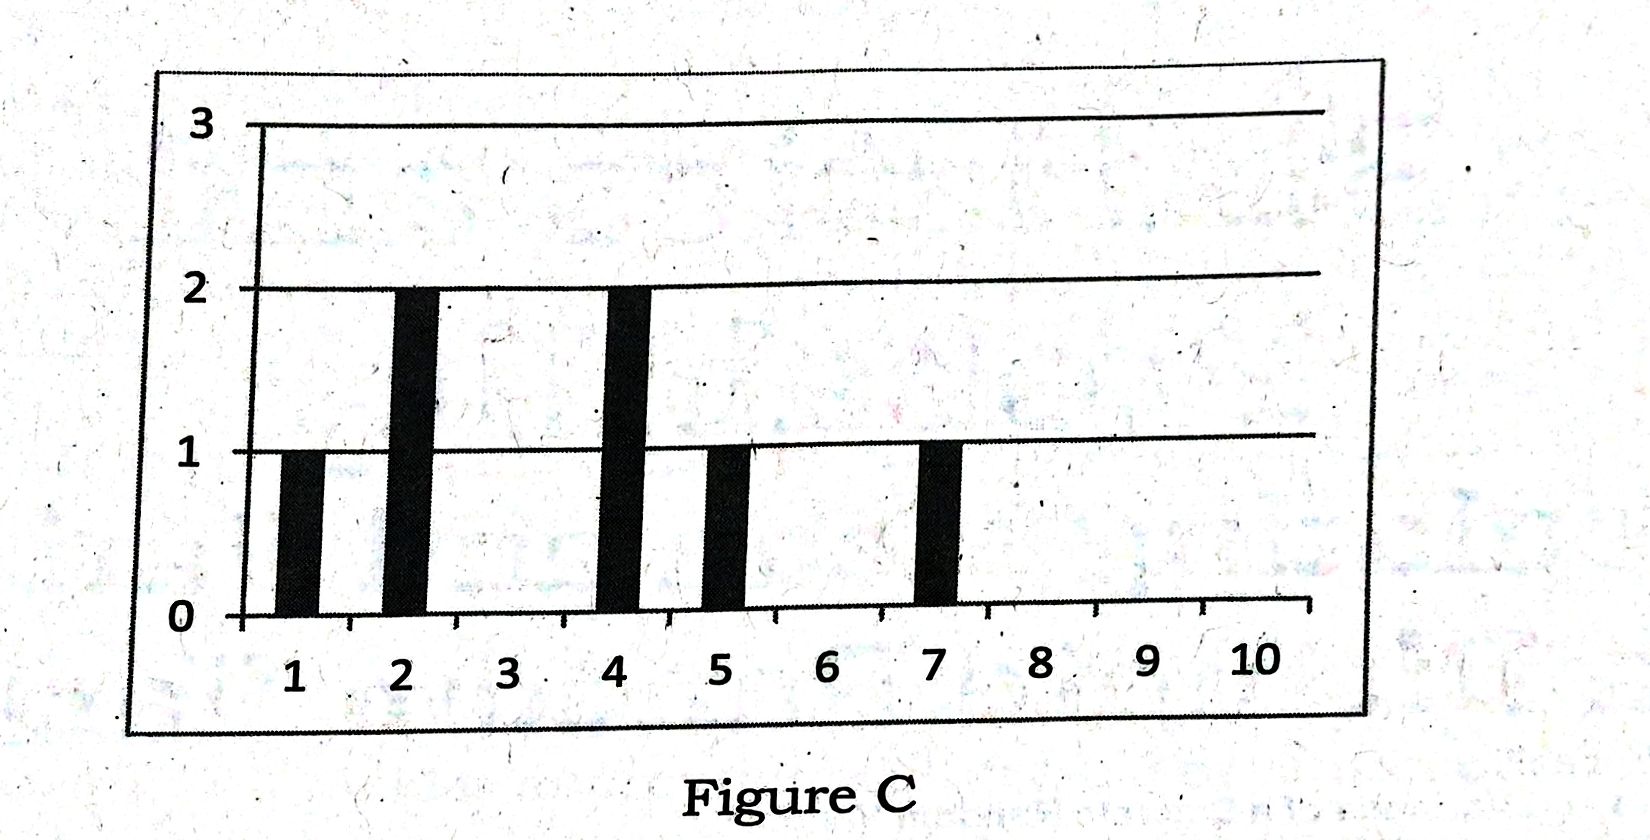
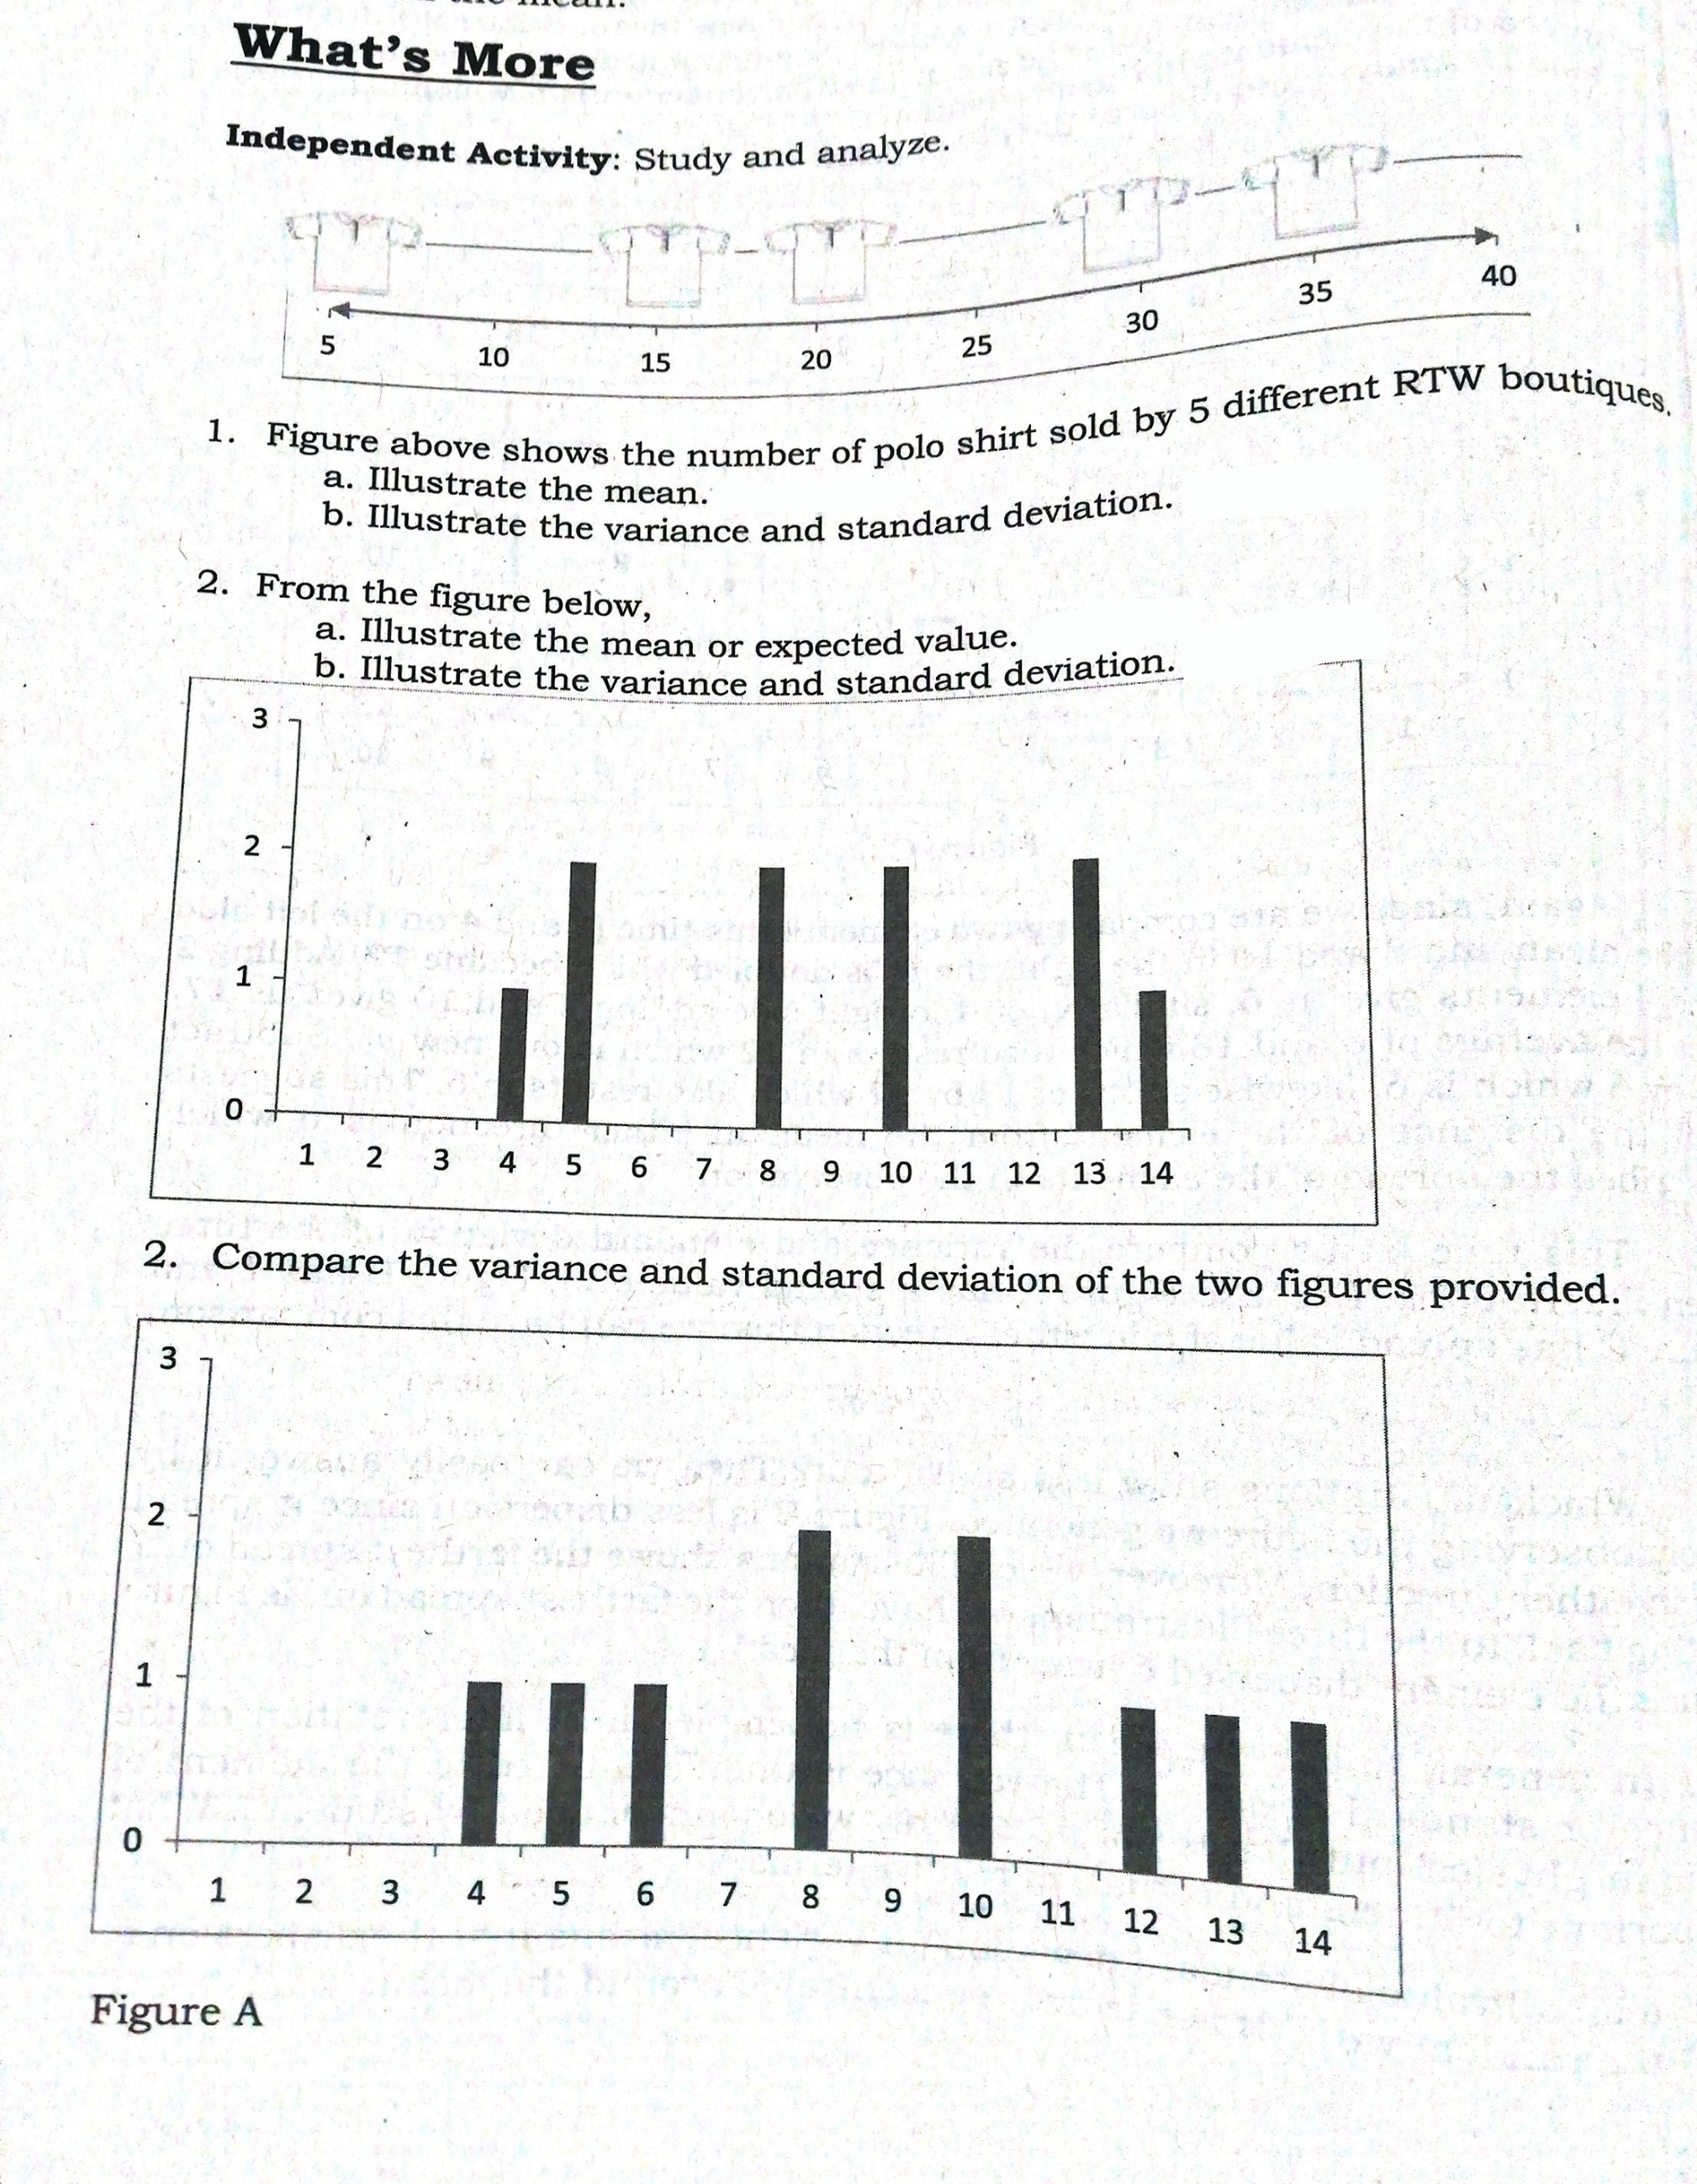
\f3 2 1 0 1 2 3 4 5 6 7 8 9 10 11 12 13 14 Figure B3 2 1 O 1 2 3 4 5 6 7 8 9! 10 Figure CWhat's More Independent Activity: Study and analyze. 40 35 30 5 10 15 20 25 1. Figure above shows the number of polo shirt sold by 5 different Ri w boutiques a. Illustrate the mean. b. Illustrate the variance and standard deviation. 2. From the figure below, a. Illustrate the mean or expected value. b. Illustrate the variance and standard deviation. 3 2 1 1 2 3 4 5 6 7 8 9 10 11 12 13 14 2. Compare the variance and standard deviation of the two figures provided. 3 2 1 0 1 2 3 4 5 6 7 8 910 11 12 13 14 Figure A
Step by Step Solution
There are 3 Steps involved in it
1 Expert Approved Answer
Step: 1 Unlock

Question Has Been Solved by an Expert!
Get step-by-step solutions from verified subject matter experts
Step: 2 Unlock
Step: 3 Unlock