

Question: f3. The graph of a function / is given. (a) State the value of /(1). (b) Estimate the value of / (-1). (c) For what

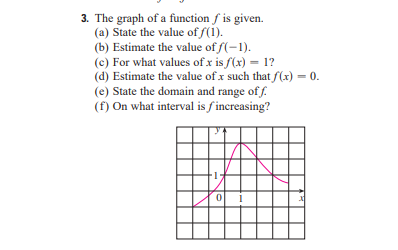
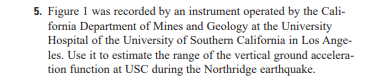

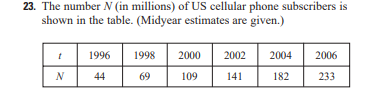


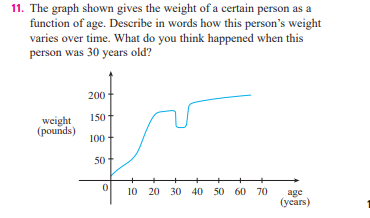


\f3. The graph of a function / is given. (a) State the value of /(1). (b) Estimate the value of / (-1). (c) For what values of x is / (x) = 1? (d) Estimate the value of x such that /(x) = 0. (e) State the domain and range of f. (f) On what interval is / increasing? 0 15. Figure I was recorded by an instrument operated by the Cali- fornia Department of Mines and Geology at the University Hospital of the University of Southern California in Los Ange- les. Use it to estimate the range of the vertical ground accelera- tion function at USC during the Northridge earthquake.11. The graph shown gives the weight of a certain person as a function of age. Describe in words how this person's weight varies over time. What do you think happened when this person was 30 years old? 200 weight 150 (pounds) 100 50 0 10 20 30 40 50 60 70 agc (years)13. You put some ice cubes in a glass, fill the glass with cold water, and then let the glass sit on a table. Describe how the temperature of the water changes as time passes. Then sketch a rough graph of the temperature of the water as a function of the elapsed time.19. Sketch the graph of the amount of a particular brand of coffee sold by a store as a function of the price of the coffee.23. The number / (in millions) of US cellular phone subscribers is shown in the table. (Midyear estimates are given.) 1996 1998 2000 2002 2004 2006 N 44 69 109 141 182 233
Step by Step Solution
There are 3 Steps involved in it

Get step-by-step solutions from verified subject matter experts