

Question: ?????????????????????????? f5. The data file HousePrices contains data on prices ($) and sizes (in square feet) for a random sample of houses that sold in
??????????????????????????
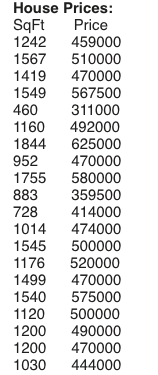
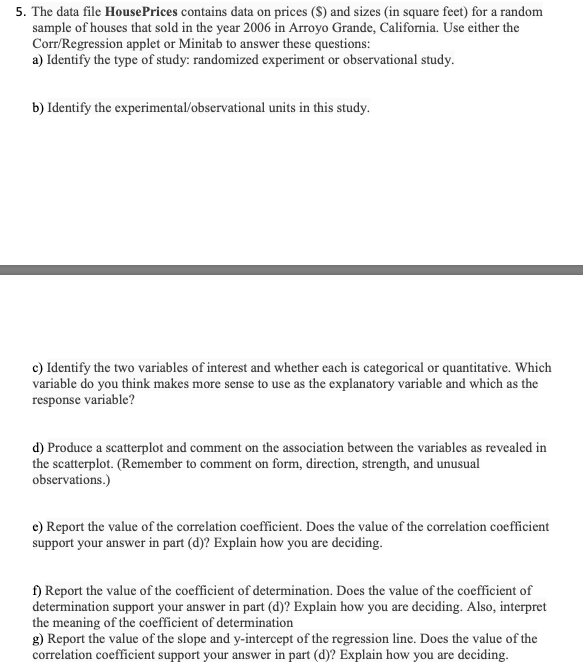
\f5. The data file HousePrices contains data on prices ($) and sizes (in square feet) for a random sample of houses that sold in the year 2006 in Arroyo Grande, California. Use either the Corr/Regression applet or Minitab to answer these questions: a) Identify the type of study: randomized experiment or observational study. b) Identify the experimental/observational units in this study. c) Identify the two variables of interest and whether each is categorical or quantitative. Which variable do you think makes more sense to use as the explanatory variable and which as the response variable? d) Produce a scatterplot and comment on the association between the variables as revealed in the scatterplot. (Remember to comment on form, direction, strength, and unusual observations.) e) Report the value of the correlation coefficient. Does the value of the correlation coefficient support your answer in part (d)? Explain how you are deciding. () Report the value of the coefficient of determination. Does the value of the coefficient of determination support your answer in part (d)? Explain how you are deciding. Also, interpret the meaning of the coefficient of determination g) Report the value of the slope and y-intercept of the regression line. Does the value of the correlation coefficient support your answer in part (d)? Explain how you are deciding
Step by Step Solution
There are 3 Steps involved in it

Get step-by-step solutions from verified subject matter experts