

Question: fa. How would you classify the type of data in each column of Table 2 4 marks b. Describe what you could deduce about the
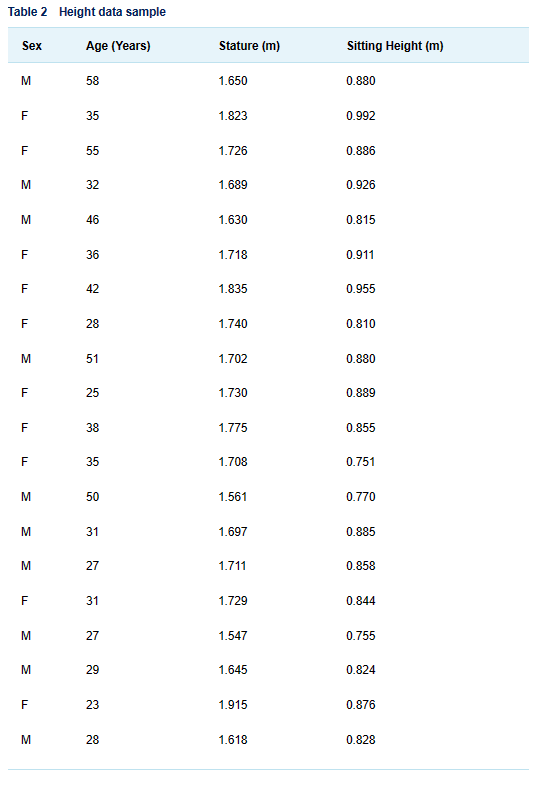
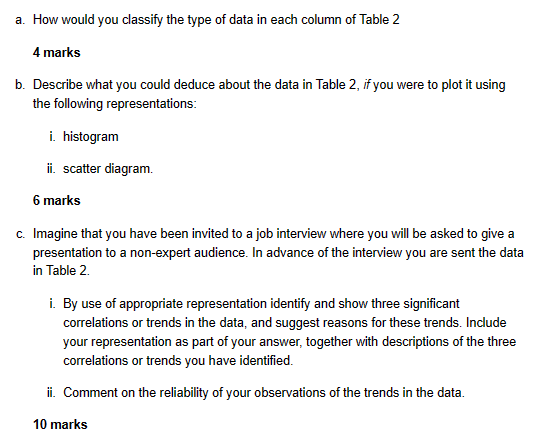
\fa. How would you classify the type of data in each column of Table 2 4 marks b. Describe what you could deduce about the data in Table 2, if you were to plot it using the following representations: i. histogram ii. scatter diagram. & marks c. Imagine that you have been invited to a job interview where you will be asked to give a presentation to a non-expert audience. In advance of the interview you are sent the data in Table 2. i. By use of appropriate representation identify and show three significant comelations or trends in the data, and suggest reasons for these trends. Include your representation as part of your answer, together with descriptions of the three correlations or trends you have identified. ii. Comment on the reliability of your observations of the trends in the data. 10 marks
Step by Step Solution
There are 3 Steps involved in it

Get step-by-step solutions from verified subject matter experts