

Question: facet 2. Use the output of the pipe to plot a histogram with education level and average yearly income, and use a wrap on
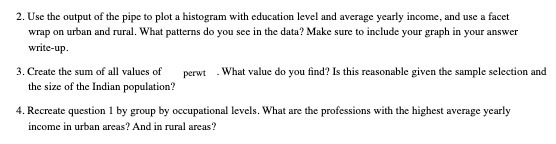
facet 2. Use the output of the pipe to plot a histogram with education level and average yearly income, and use a wrap on urban and rural. What patterns do you see in the data? Make sure to include your graph in your answer write-up. 3. Create the sum of all values of the size of the Indian population? perwt . What value do you find? Is this reasonable given the sample selection and 4. Recreate question 1 by group by occupational levels. What are the professions with the highest average yearly income in urban areas? And in rural areas?
Step by Step Solution
There are 3 Steps involved in it
1 Expert Approved Answer
Step: 1 Unlock

Question Has Been Solved by an Expert!
Get step-by-step solutions from verified subject matter experts
Step: 2 Unlock
Step: 3 Unlock