Question: Factorial Design and Analysis Exercise Will the depth to which information is processed affect how well it can be remembered? And, if so, would such
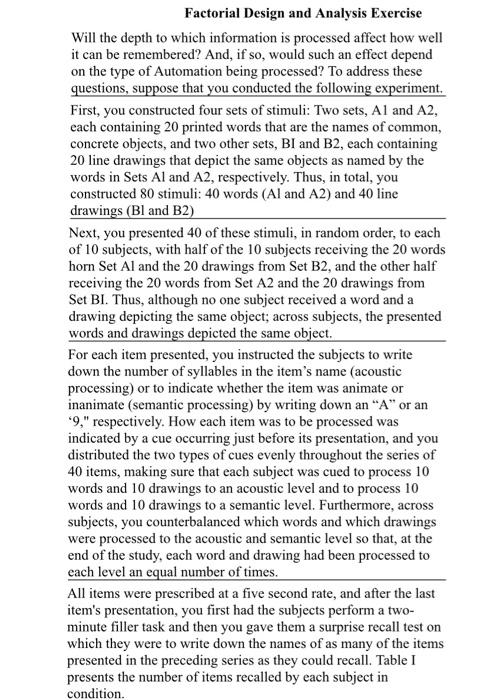
Factorial Design and Analysis Exercise Will the depth to which information is processed affect how well it can be remembered? And, if so, would such an effect depend on the type of Automation being processed? To address these questions, suppose that you conducted the following experiment. First, you constructed four sets of stimuli: Two sets, Al and A2, each containing 20 printed words that are the names of common, concrete objects, and two other sets, BI and B2, each containing 20 line drawings that depict the same objects as named by the words in Sets Al and A2, respectively. Thus, in total, you constructed 80 stimuli: 40 words (Al and A2) and 40 line drawings (Bl and B2) Next, you presented 40 of these stimuli, in random order, to each of 10 subjects, with half of the 10 subjects receiving the 20 words horn Set Al and the 20 drawings from Set B2, and the other half receiving the 20 words from Set A2 and the 20 drawings from Set BI. Thus, although no one subject received a word and a drawing depicting the same object; across subjects, the presented words and drawings depicted the same object. For each item presented, you instructed the subjects to write down the number of syllables in the item's name (acoustic processing) or to indicate whether the item was animate or inanimate (semantic processing) by writing down an "A" or an 9," respectively. How each item was to be processed was indicated by a cue occurring just before its presentation, and you distributed the two types of cues evenly throughout the series of 40 items, making sure that each subject was cued to process 10 words and 10 drawings to an acoustic level and to process 10 words and 10 drawings to a semantic level. Furthermore, across subjects, you counterbalanced which words and which drawings were processed to the acoustic and semantic level so that, at the end of the study, each word and drawing had been processed to each level an equal number of times. All items were prescribed at a five second rate, and after the last item's presentation, you first had the subjects perform a two- minute filler task and then you gave them a surprise recall test on which they were to write down the names of as many of the items presented in the preceding series as they could recall. Table I presents the number of items recalled by each subject in condition. The Results Section Content The primary function of the Results section is to tell the reader exactly what your study found. When clearly written, it allows others to evaluate your results independently of your own interpretations, which you present in the Discussion section. The results section summarizes the data that you have collected, your statistical treatment of that data, and the outcomes of those statistical analyses. The results and the analyses performed must be presented in sufficient detail to support your conclusions. All relevant results must be reported, including those that do not support your original hypotheses. Do NOT, however, report raw data or individual scores, Unless you are writing a combined Results and Discussion section (which we do not do), you do NOT discuss the implications of your findings in the Results section. (For this class, we will follow the APA guideline of using a separate Discussion section.) This admonition not to discuss the implications of your findings in the Results section is sometimes confusing. It does not mean that you cannot verbally describe what your findings mean or explain why a particular comparison was made. In fact, such verbal descriptions are typically necessary for readers to comprehend your Results section. Rather, this caution means that you do not launch into lengthy discussions of your findings in terms of their relationship to previous research and theories and/or their implications for future research. Discussing these latter types of implications is reserved for the separate Discussion section of your report. Organization In general, present your findings in the order of their importance. For example, if you had a primary hypothesis that you were testing and two secondary ones, you would present the results and statistical analyses relevant to the primary hypothesis first. Using Figures and Tables Tables and/or figures can be helpful in making clear to the reader what you found and what can be concluded from your findings. Typically, you would at least present the results relevant to your main hypothesis in a figure or a table. Which to use is largely up to you. Tables give exact values, whereas the exact value of data points presented in a figure can often not be determined. Also, figures are harder to prepare and more expensive to publish. On the other hand, figures are more dramatic and illustrate trends, relationships, and interactions more clearly. Whichever you clect to use, you must label them with an Arabic number (e.g. Figure 1. Figure 2. Table 1, Table 2, etc.). You must refer to each in the text, and you must verbally describe what results are being displayed. For example, you might write: Timel chase the averartion af arte that were