

Question: Factors for calculating three-sigma limits for the x-chart and R-chart Size of Sample Factor for UCL and LCL Factor for LCL for Factor for UCL
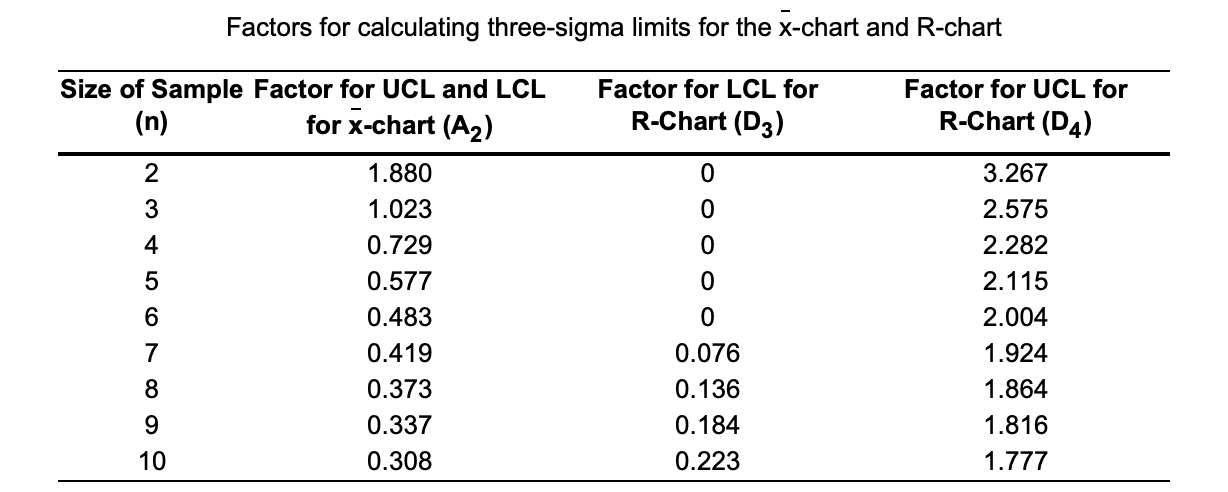
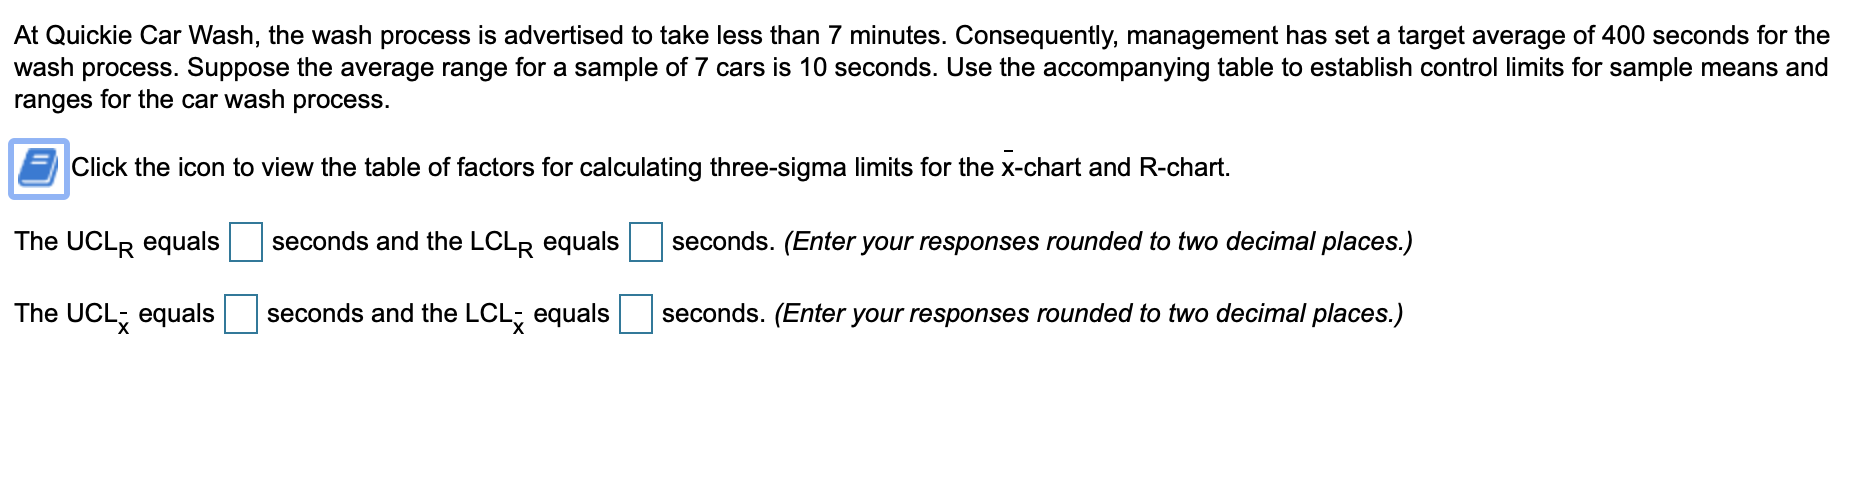
Factors for calculating three-sigma limits for the x-chart and R-chart Size of Sample Factor for UCL and LCL Factor for LCL for Factor for UCL for for x-chart (A2) R-Chart (D3) R-Chart (D4) 1.880 3.267 1.023 2.575 0.729 ooooo 2.282 CO O VOUIA WN E 0.577 2.115 0.483 2.004 0.419 0.076 1.924 0.373 0. 136 1.864 0.337 0.184 1.816 10 0.308 0.223 1.777At Quickie Car Wash, the wash process is advertised to take less than 7 minutes. Consequently, management has set a target average of 400 seconds for the wash process. Suppose the average range for a sample of 7 cars is 10 seconds. Use the accompanying table to establish control limits for sample means and ranges for the car wash process. .Click the icon to view the table of factors for calculating three-sigma limits for the ichart and R-chart. The UCLR equals :l seconds and the LCLR equals seconds. (Enter your responses rounded to two decimal places.) The UCLi equals D seconds and the LCLi equals El seconds. (Enter your responses rounded to two decimal places.)
Step by Step Solution
There are 3 Steps involved in it

Get step-by-step solutions from verified subject matter experts