

Question: Factors for calculating three-sigma limits for the x-chart and R-chart Factors for calculating three-sigma limits for the x-chart and R-chart At Quick Car Wash, the
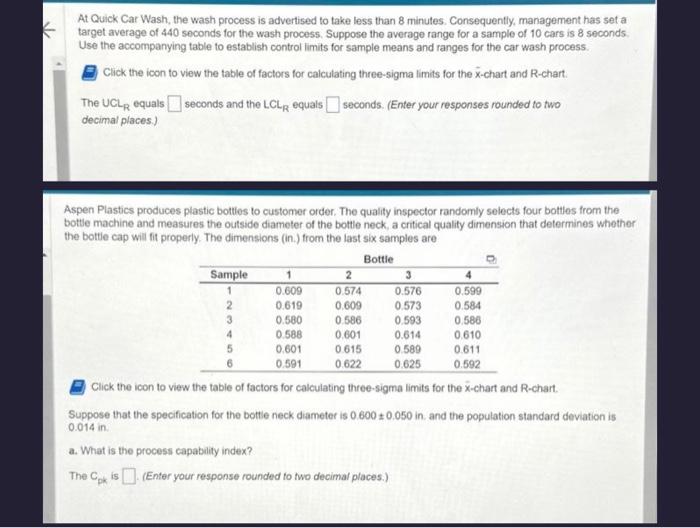
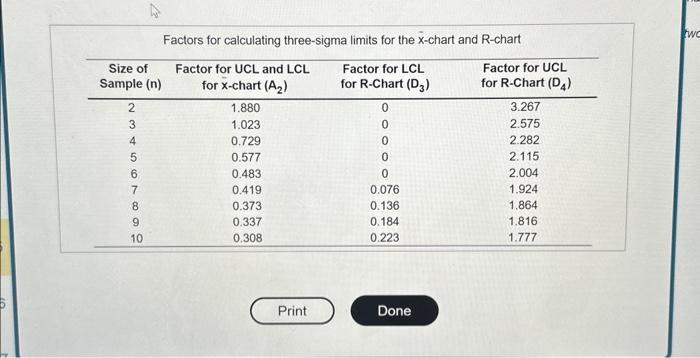
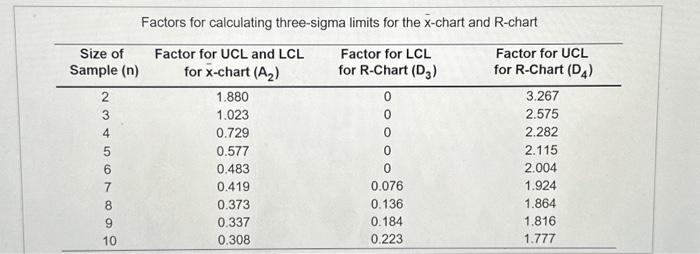
Factors for calculating three-sigma limits for the x-chart and R-chart Factors for calculating three-sigma limits for the x-chart and R-chart At Quick Car Wash, the wash process is advertised to take less than 8 minutes. Consequently, management has set a target average of 440 seconds for the wash process. Suppose the average range for a sample of 10 cars is 8 seconds Use the accompanying table to establish control limits for sample means and ranges for the car wash process. Click the icon to view the table of factors for calculating three-sigma limits for the x-chart and R-chart. The UCL LR equals seconds and the LCLR equals seconds. (Enter your responses rounded to two decimal places.) Aspen Plastics produces plastic bottles to customer order. The quality inspector randomly selects four bottles from the bottle machine and measures the outside diameter of the bottle neck, a critical quality dimension that determines whether the bottle cap will fit properly. The dimensions (in.) from the last six samples are Click the icon to view the tabie of factors for calculating three-sigma limits for the x-chart and R-chart. Suppose that the specification for the bottle neck diameter is 0.6000.050 in. and the population standard deviation is 0.014 in. a. What is the process capability index? The Cpk is (Enter your response rounded to two decimal places.)
Step by Step Solution
There are 3 Steps involved in it

Get step-by-step solutions from verified subject matter experts