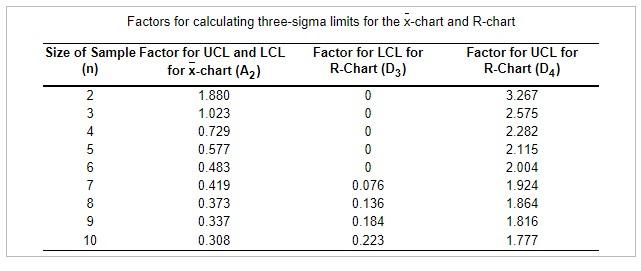
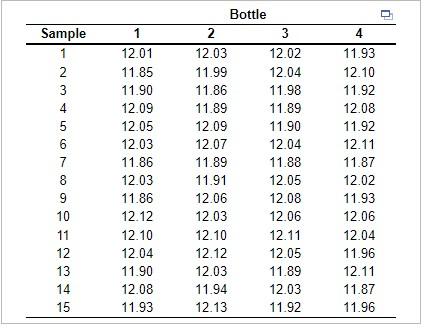
Question: Factors for calculating three-sigma limits for the x-chart and R-chart begin{tabular}{ccccc} multicolumn{5}{c}{ Bottle } hline Sample & 1 & 2 & 3 & 4

Factors for calculating three-sigma limits forFactors for calculating three-sigma limits forFactors for calculating three-sigma limits for

Factors for calculating three-sigma limits for the x-chart and R-chart \begin{tabular}{ccccc} \multicolumn{5}{c}{ Bottle } \\ \hline Sample & 1 & 2 & 3 & 4 \\ \hline 1 & 12.01 & 12.03 & 12.02 & 11.93 \\ 2 & 11.85 & 11.99 & 12.04 & 12.10 \\ 3 & 11.90 & 11.86 & 11.98 & 11.92 \\ 4 & 12.09 & 11.89 & 11.89 & 12.08 \\ 5 & 12.05 & 12.09 & 11.90 & 11.92 \\ 6 & 12.03 & 12.07 & 12.04 & 12.11 \\ 7 & 11.86 & 11.89 & 11.88 & 11.87 \\ 8 & 12.03 & 11.91 & 12.05 & 12.02 \\ 9 & 11.86 & 12.06 & 12.08 & 11.93 \\ 10 & 12.12 & 12.03 & 12.06 & 12.06 \\ 11 & 12.10 & 12.10 & 12.11 & 12.04 \\ 12 & 12.04 & 12.12 & 12.05 & 11.96 \\ 13 & 11.90 & 12.03 & 11.89 & 12.11 \\ 14 & 12.08 & 11.94 & 12.03 & 11.87 \\ 15 & 11.93 & 12.13 & 11.92 & 11.96 \\ \hline \end{tabular} design standard for the product calls for a fill level of 120.10 ounces. The manager collected the accompanying sample data (in fluid ounces per bottle) on the production process. Click the icon to view the sample data. Click the icon to view the table of factors for calculating three-sigma limits for the x-chart and R-chart. Design an R- and an x-chart for this process. The UCLR equals ounces and the LCLR equals ounces. (Enter your responses rounded to three decimal places.)

Step by Step Solution

There are 3 Steps involved in it

1 Expert Approved Answer
Step: 1 Unlock blur-text-image
Question Has Been Solved by an Expert!

Get step-by-step solutions from verified subject matter experts

Step: 2 Unlock
Step: 3 Unlock

Students Have Also Explored These Related General Management Questions!