

Question: Facts: It is 2019 Wolverine Inc. is considering making an offer to purchase Spartan Industries, Inc. (Spartan). You are a financial analyst working at an
Facts:
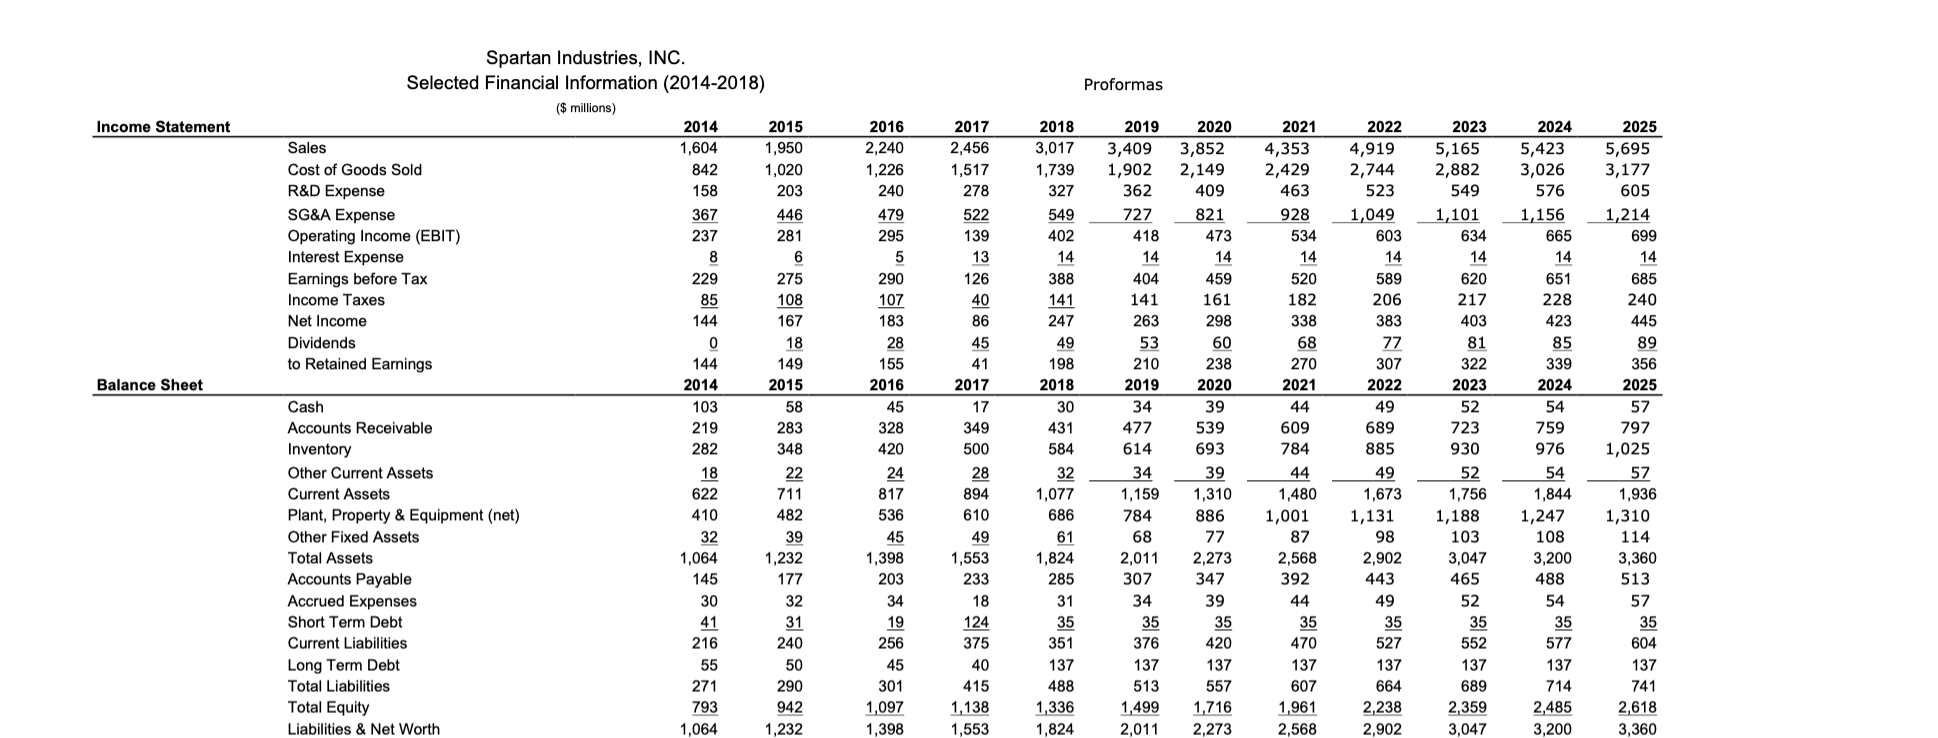
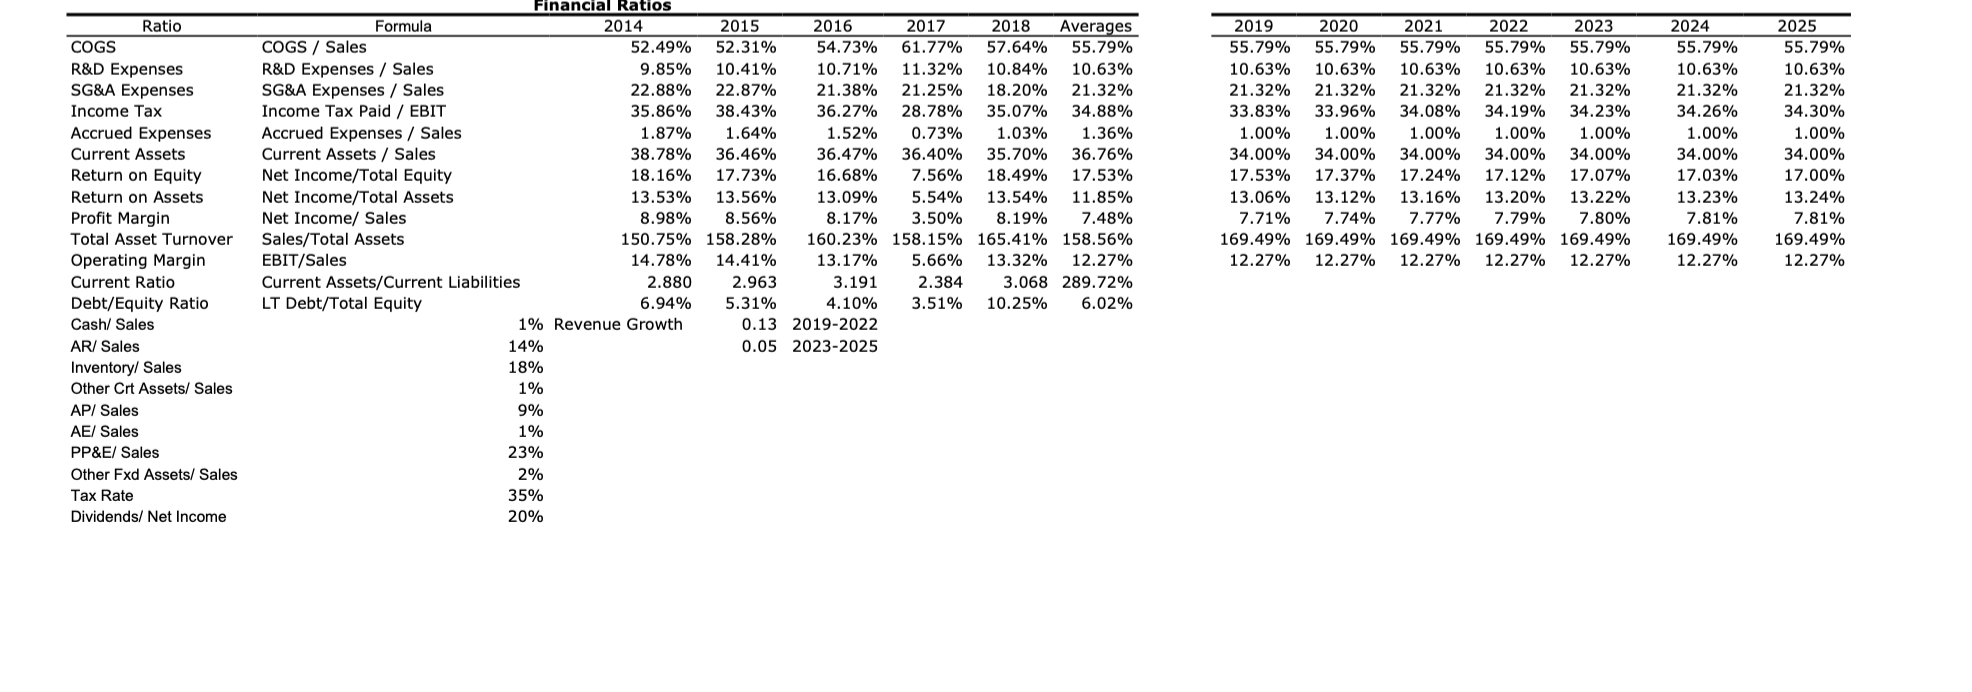
It is 2019 Wolverine Inc. is considering making an offer to purchase Spartan Industries, Inc. (Spartan). You are a financial analyst working at an investment bank hired by Spartan tasked with determining a value of the company so they may evaluate the offer.
You determined that Spartan will require additional capital to support the production and distribution of its second generation of products. Accordingly, you must now determine the optimal debt level Spartan can comfortably support.
You are uncertain of Spartans appropriate Coverage Ratio (h) and Cost of Capital (rD), but you are aware of the following:
1.In 2018, Spartan issued $97 million in debt with an interest rate of 8.25%; and
2.Wolverine, a direct competitor of Spartan, uses a Coverage Ratio of 2.
Additionally, you are aware that Spartan has 50,000,000 shares outstanding with a current stock price of $58/share.
Calculate the following for BCI:
Market value of equity;
Total capital;
Current debt: total capital ratio;
Current equity: total capital ratio.
Spartan Industries, INC Selected Financial Information (2014-2018) Proformas ($ millions) Income Statement 2014 2015 2016 2017 2018 2019 2020 2021 2022 2023 2024 2025 3,852 2,149 Sales 3,409 1,902 4,919 2,744 5,165 2,882 5,423 3,026 1,604 1,950 2,240 2,456 3,017 4,353 2,429 5,695 3,177 1,226 Cost of Goods Sold 842 1,020 1,517 1,739 R&D Expense 362 409 523 549 605 158 203 240 278 327 463 576 SG&A Expense 727 821 928 1,101 1,156 1,214 367 446 479 522 549 1,049 Operating Income (EBIT) Interest Expense 237 281 295 139 402 418 473 534 603 634 665 699 13 8 5 14 14 14 14 14 14 14 14 Earnings before Tax 229 275 290 126 388 404 459 520 589 620 651 685 Income Taxes 161 182 206 217 228 240 85 108 107 40 141 247 141 86 403 Net Income 144 167 183 263 298 338 383 423 445 18 53 60 68 77 81 85 89 Dividends 28 45 49 to Retained Earnings 144 149 155 41 198 210 238 270 307 322 339 356 Balance Sheet 2014 2019 2015 2016 2017 2018 2020 2021 2022 2023 2024 2025 34 39 49 52 57 Cash 103 58 45 17 30 44 54 539 609 689 723 759 797 Accounts Receivable 219 283 328 349 431 477 976 Inventory 584 614 693 784 885 930 282 348 420 500 1,025 Other Current Assets 22 28 34 39 52 18 24 32 1,077 44 1,480 1,001 49 54 57 1,936 1,310 Current Assets 622 711 817 894 1,159 1,310 1,673 1,756 1,844 1,188 Plant, Property & Equipment (net) 410 482 536 610 686 784 886 1,131 98 1,247 Other Fixed Assets 68 87 103 32 1,064 39 45 1,398 49 61 77 108 114 2,568 3,200 3,360 Total Assets 1,232 1,553 1,824 2,011 307 2,273 2,902 3,047 Accounts Payable 392 145 177 203 233 285 347 443 465 488 513 Accrued Expenses 34 39 49 30 32 34 18 31 44 52 54 57 Short Term Debt 41 31 19 124 35 35 35 35 35 35 35 35 Current Liabilities 216 240 256 375 351 376 420 470 527 552 577 604 Long Term Debt 55 50 45 40 137 137 137 137 137 137 137 137 Total Liabilities 271 290 301 415 488 513 557 607 664 689 714 741 1,716 2,273 Total Equity 1,138 2,618 793 942 1,097 1,336 1,499 1,961 2,238 2,359 2,485 Liabilities &Net Worth 1,064 1,232 1,398 1,553 1,824 2,011 2,568 2,902 3,047 3,200 3,360 Financial Ratios Formula 2014 2015 2016 2022 2023 2024 2025 Ratio 2017 2018 Averages 2019 2020 2021 COGS/ Sales 52.49% 54.73% 55.79% COGS 52.31% 61.77% 57.64% 55.79% 55.79% 55.79% 55.79% 55.79% 55.79% 55.79% R&D Expenses SG&A Expenses R&D Expenses / Sales SG&A Expenses / Sales Income Tax Paid / EBIT 10.41% 22.87% 10.63% 10.63% 10.63% 10.63% 9.85% 10.71% 11.32% 10.84% 10.63% 10.63% 10.63% 10.63% 21.38% 21.32% 21.32% 21.32% 21.32% 21.32% 21.32% 22.88% 21.25% 18.20% 21.32% 21.32% 38.43% 36.27% Income Tax 35.86% 28.78% 35.07% 34.88% 33.83% 33.96% 34.08% 34.19% 34.23% 34.26% 34.30% 1.00% 34.00% Accrued Expenses Accrued Expenses / Sales Current Assets / Sales Net Income/Total Equity 1.00% 1.00% 1.87% 1.64% 1.52% 0.73% 1.03% 1.36% 1.00% 1.00% 1.00% 1.00% 36.46% 36.47% 34.00% 34.00% 34.00% Current Assets 38.78% 36.40% 35.70% 36.76% 34.00% 34.00% 34.00% Return on Equity 16.68% 17.00% 18.16% 17.73% 7.56% 18.49% 17.53% 17.53% 17.37% 17.24% 17.12% 17.07% 17.03% 13.53% Net Income/Total Assets 13.54% 13.06% 13.16% 13.22% Return on Assets 13.56% 13.09% 5.54% 11.85% 13.12% 13.20% 13.23% 13.24% Profit Margin 7.81% 8.56% 3.50% 7.74% 7.77% Net Income/ Sales Sales/Total Assets EBIT/Sales 8.98% 8.17% 8.19% 7.48% 7.71% 7.79% 7.80% 7.81% 169.49% 169.49% Total Asset Turnover 150.75% 158.28% 160.23% 158.15% 165.41% 158.56% 169.49% 169.49% 169.49% 169.49% 169.49% 12.27% 13.32% 12.27% 12.27% 12.27% Operating Margin 14.78% 14.41% 13.17% 5.66% 12.27% 12.27% 12.27% 12.27% 3.068 289.72% Current Ratio Current Assets/Current Liabilities 2.880 2.963 3.191 2.384 LT Debt/Total Equity 5.31% 4.10% 6.02% Debt/Equity Ratio 6.94% 3.51% 10.25% Cash/ Sales 1% Revenue Growth 0.13 2019-2022 AR/ Sales 14% 0.05 2023-2025 Inventory/ Sales 18% Other Crt Assets/ Sales 1% AP/ Sales 9% AE/ Sales 1% PP&E/ Sales 23% Other Fxd Assets/ Sales 2% Tax Rate 35% 20% Dividends/ Net Income Spartan Industries, INC Selected Financial Information (2014-2018) Proformas ($ millions) Income Statement 2014 2015 2016 2017 2018 2019 2020 2021 2022 2023 2024 2025 3,852 2,149 Sales 3,409 1,902 4,919 2,744 5,165 2,882 5,423 3,026 1,604 1,950 2,240 2,456 3,017 4,353 2,429 5,695 3,177 1,226 Cost of Goods Sold 842 1,020 1,517 1,739 R&D Expense 362 409 523 549 605 158 203 240 278 327 463 576 SG&A Expense 727 821 928 1,101 1,156 1,214 367 446 479 522 549 1,049 Operating Income (EBIT) Interest Expense 237 281 295 139 402 418 473 534 603 634 665 699 13 8 5 14 14 14 14 14 14 14 14 Earnings before Tax 229 275 290 126 388 404 459 520 589 620 651 685 Income Taxes 161 182 206 217 228 240 85 108 107 40 141 247 141 86 403 Net Income 144 167 183 263 298 338 383 423 445 18 53 60 68 77 81 85 89 Dividends 28 45 49 to Retained Earnings 144 149 155 41 198 210 238 270 307 322 339 356 Balance Sheet 2014 2019 2015 2016 2017 2018 2020 2021 2022 2023 2024 2025 34 39 49 52 57 Cash 103 58 45 17 30 44 54 539 609 689 723 759 797 Accounts Receivable 219 283 328 349 431 477 976 Inventory 584 614 693 784 885 930 282 348 420 500 1,025 Other Current Assets 22 28 34 39 52 18 24 32 1,077 44 1,480 1,001 49 54 57 1,936 1,310 Current Assets 622 711 817 894 1,159 1,310 1,673 1,756 1,844 1,188 Plant, Property & Equipment (net) 410 482 536 610 686 784 886 1,131 98 1,247 Other Fixed Assets 68 87 103 32 1,064 39 45 1,398 49 61 77 108 114 2,568 3,200 3,360 Total Assets 1,232 1,553 1,824 2,011 307 2,273 2,902 3,047 Accounts Payable 392 145 177 203 233 285 347 443 465 488 513 Accrued Expenses 34 39 49 30 32 34 18 31 44 52 54 57 Short Term Debt 41 31 19 124 35 35 35 35 35 35 35 35 Current Liabilities 216 240 256 375 351 376 420 470 527 552 577 604 Long Term Debt 55 50 45 40 137 137 137 137 137 137 137 137 Total Liabilities 271 290 301 415 488 513 557 607 664 689 714 741 1,716 2,273 Total Equity 1,138 2,618 793 942 1,097 1,336 1,499 1,961 2,238 2,359 2,485 Liabilities &Net Worth 1,064 1,232 1,398 1,553 1,824 2,011 2,568 2,902 3,047 3,200 3,360 Financial Ratios Formula 2014 2015 2016 2022 2023 2024 2025 Ratio 2017 2018 Averages 2019 2020 2021 COGS/ Sales 52.49% 54.73% 55.79% COGS 52.31% 61.77% 57.64% 55.79% 55.79% 55.79% 55.79% 55.79% 55.79% 55.79% R&D Expenses SG&A Expenses R&D Expenses / Sales SG&A Expenses / Sales Income Tax Paid / EBIT 10.41% 22.87% 10.63% 10.63% 10.63% 10.63% 9.85% 10.71% 11.32% 10.84% 10.63% 10.63% 10.63% 10.63% 21.38% 21.32% 21.32% 21.32% 21.32% 21.32% 21.32% 22.88% 21.25% 18.20% 21.32% 21.32% 38.43% 36.27% Income Tax 35.86% 28.78% 35.07% 34.88% 33.83% 33.96% 34.08% 34.19% 34.23% 34.26% 34.30% 1.00% 34.00% Accrued Expenses Accrued Expenses / Sales Current Assets / Sales Net Income/Total Equity 1.00% 1.00% 1.87% 1.64% 1.52% 0.73% 1.03% 1.36% 1.00% 1.00% 1.00% 1.00% 36.46% 36.47% 34.00% 34.00% 34.00% Current Assets 38.78% 36.40% 35.70% 36.76% 34.00% 34.00% 34.00% Return on Equity 16.68% 17.00% 18.16% 17.73% 7.56% 18.49% 17.53% 17.53% 17.37% 17.24% 17.12% 17.07% 17.03% 13.53% Net Income/Total Assets 13.54% 13.06% 13.16% 13.22% Return on Assets 13.56% 13.09% 5.54% 11.85% 13.12% 13.20% 13.23% 13.24% Profit Margin 7.81% 8.56% 3.50% 7.74% 7.77% Net Income/ Sales Sales/Total Assets EBIT/Sales 8.98% 8.17% 8.19% 7.48% 7.71% 7.79% 7.80% 7.81% 169.49% 169.49% Total Asset Turnover 150.75% 158.28% 160.23% 158.15% 165.41% 158.56% 169.49% 169.49% 169.49% 169.49% 169.49% 12.27% 13.32% 12.27% 12.27% 12.27% Operating Margin 14.78% 14.41% 13.17% 5.66% 12.27% 12.27% 12.27% 12.27% 3.068 289.72% Current Ratio Current Assets/Current Liabilities 2.880 2.963 3.191 2.384 LT Debt/Total Equity 5.31% 4.10% 6.02% Debt/Equity Ratio 6.94% 3.51% 10.25% Cash/ Sales 1% Revenue Growth 0.13 2019-2022 AR/ Sales 14% 0.05 2023-2025 Inventory/ Sales 18% Other Crt Assets/ Sales 1% AP/ Sales 9% AE/ Sales 1% PP&E/ Sales 23% Other Fxd Assets/ Sales 2% Tax Rate 35% 20% Dividends/ Net Income
Step by Step Solution
There are 3 Steps involved in it

Get step-by-step solutions from verified subject matter experts