

Question: Please fill out the excel sheet below completely: Cakes Sold per day Average Retail per Cake Cakes Sold per year Gross Sales (year) Rent Utilities
Please fill out the excel sheet below completely:
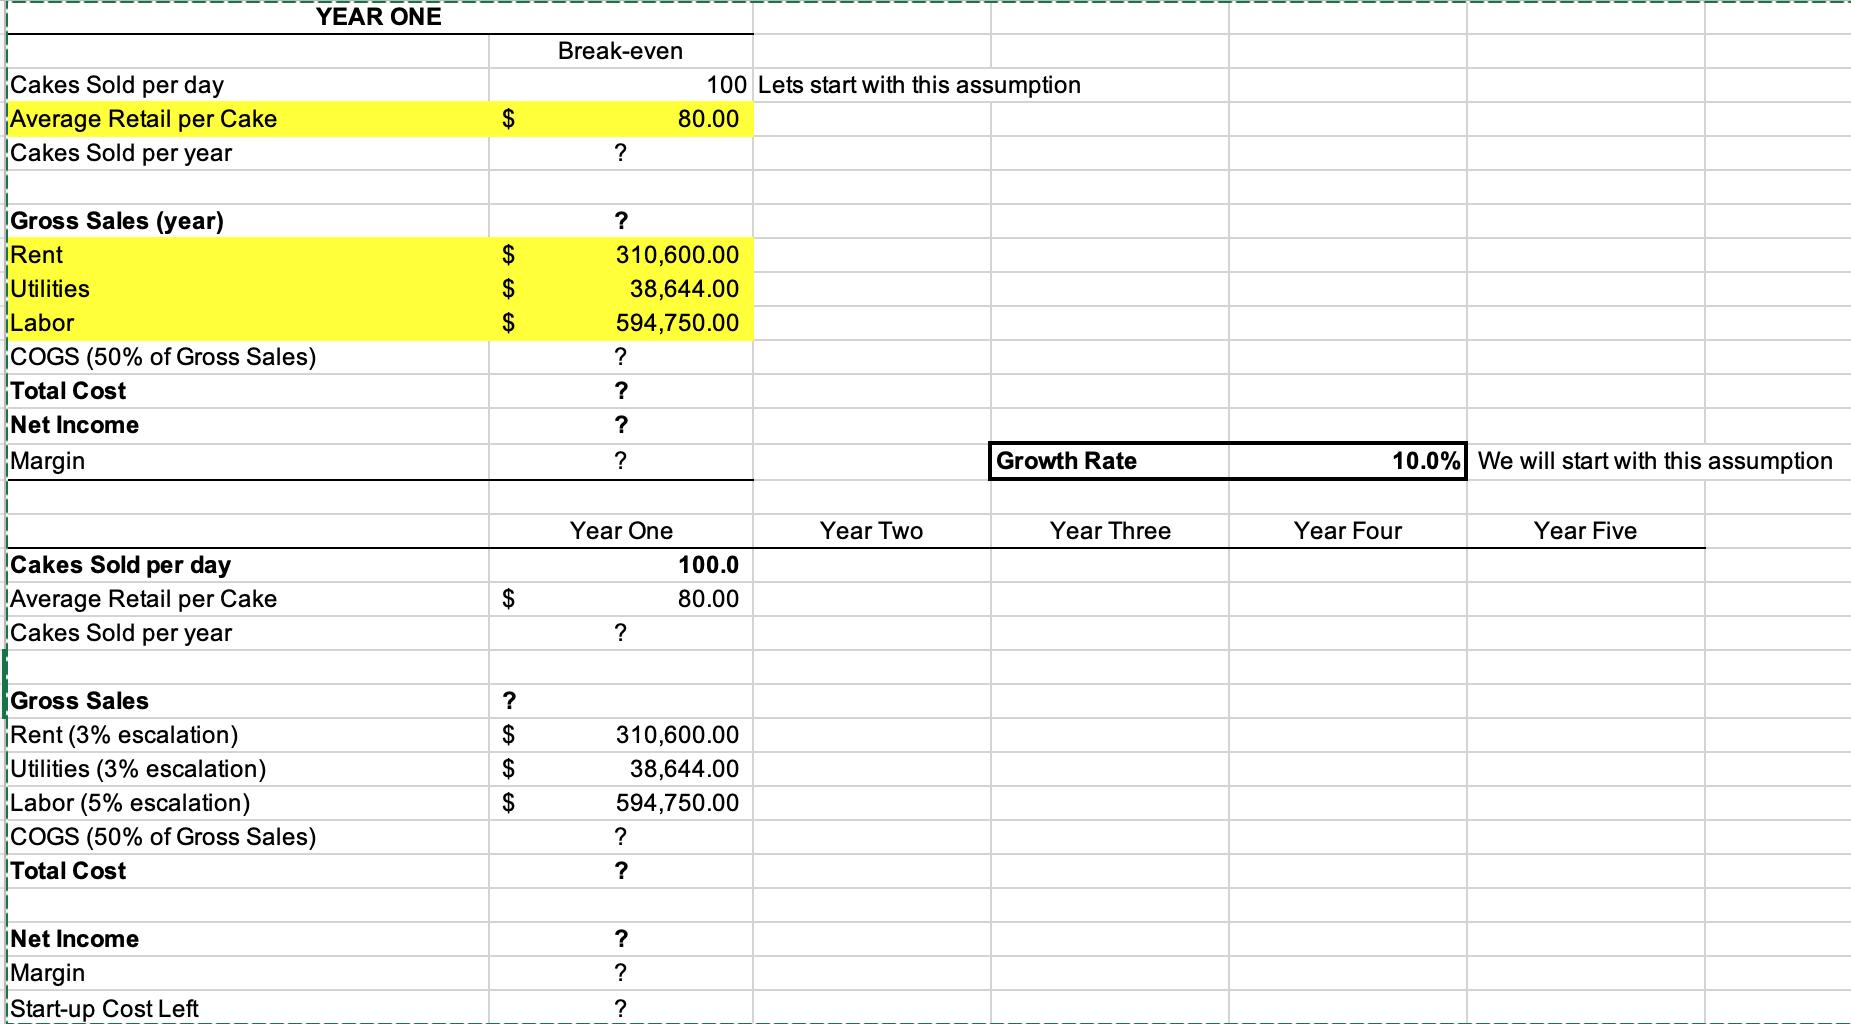
Cakes Sold per day Average Retail per Cake Cakes Sold per year Gross Sales (year) Rent Utilities Labor COGS (50% of Gross Sales) Total Cost Net Income Margin Cakes Sold per day Average Retail per Cake Cakes Sold per year YEAR ONE Gross Sales Rent (3% escalation) Utilities (3% escalation) Labor (5% escalation) COGS (50% of Gross Sales) Total Cost Net Income Margin Start-up Cost Left $ $ LA LA LA $ $ 7.SSA LA ? $ $ $ Break-even ? ? 310,600.00 38,644.00 594,750.00 ? ? ? ? Year One ? 100 Lets start with this assumption 80.00 ? ? 310,600.00 38,644.00 594,750.00 ? ? ? 100.0 80.00 Year Two Growth Rate Year Three 10.0% We will start with this assun Year Four Year Five
Step by Step Solution
3.42 Rating (158 Votes )
There are 3 Steps involved in it
Here is the completed Excel sheet YEAR ONE Cakes Sold per day 100 Average Retail per Cake 5 Cakes So... View full answer

Get step-by-step solutions from verified subject matter experts