

Question: fast... 1. Original Data (a) Step change Table 1: Initial Flowrate=30LPH; Final Flowrate = 50LPH t (s) H(calc) (cm) t (s) H(calc) (cm) h (cm)
fast...
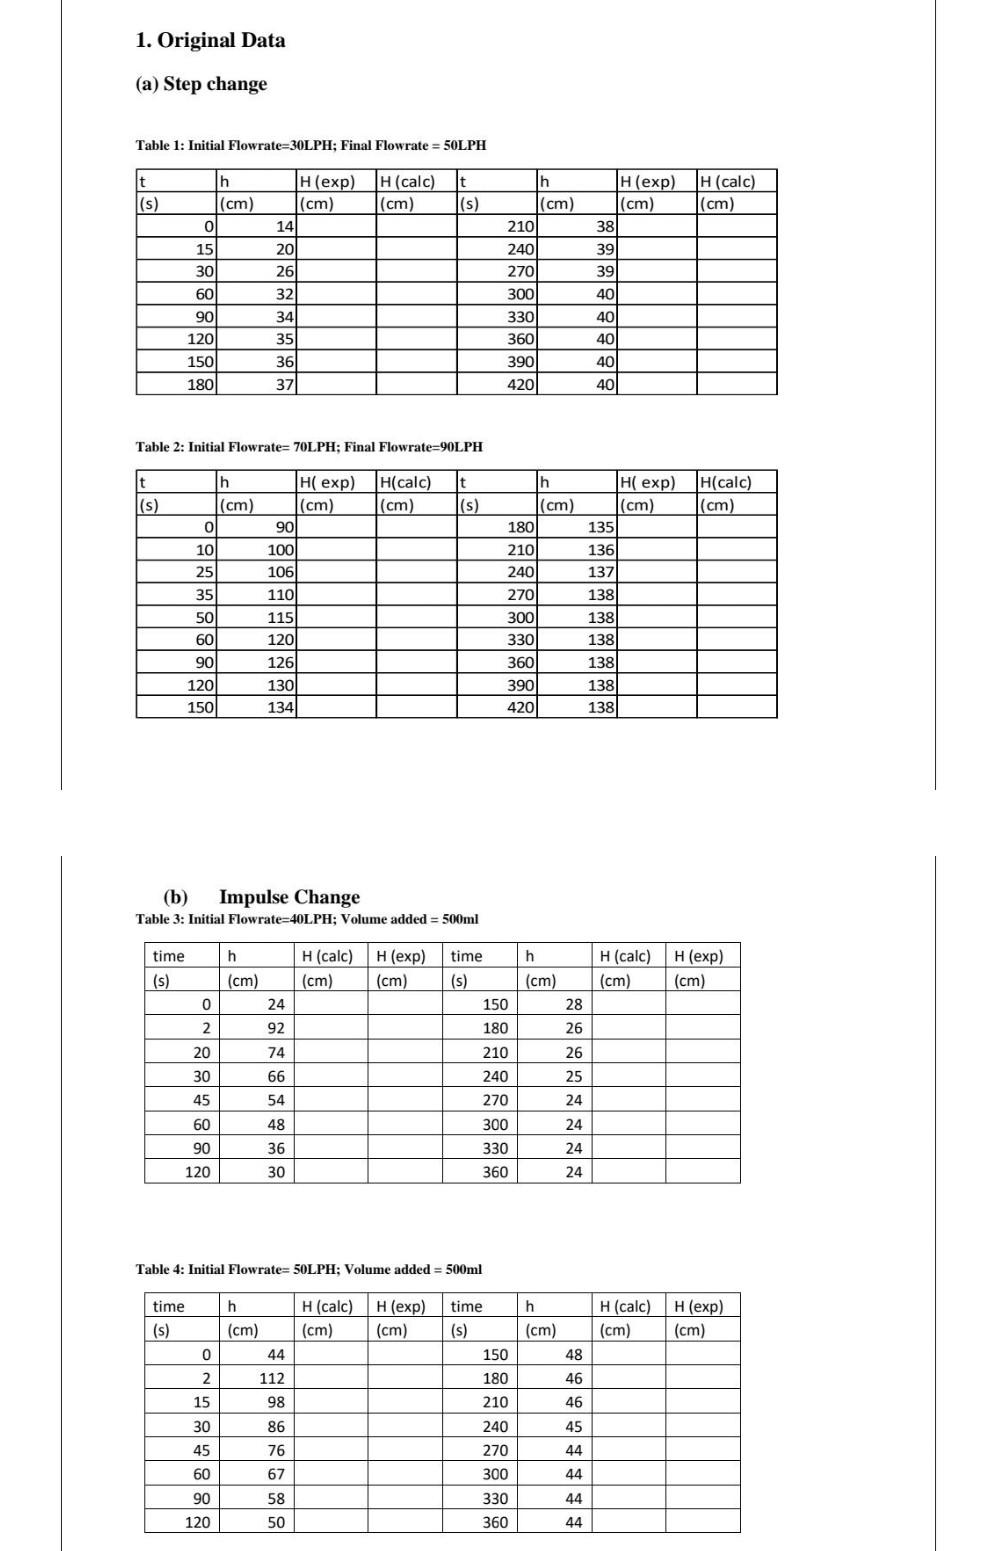
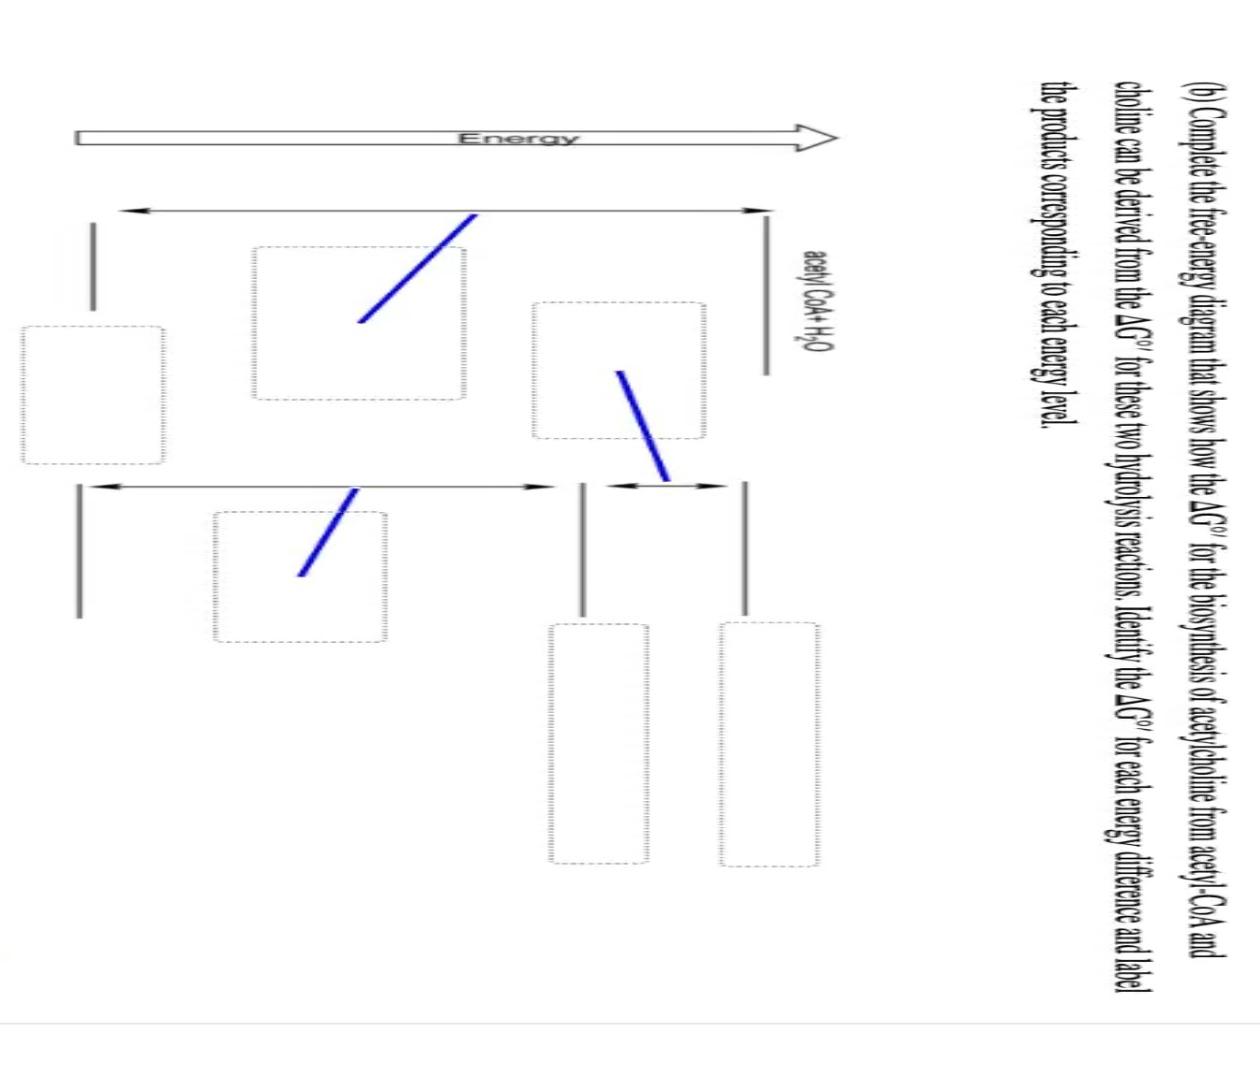
1. Original Data (a) Step change Table 1: Initial Flowrate=30LPH; Final Flowrate = 50LPH t (s) H(calc) (cm) t (s) H(calc) (cm) h (cm) 0 15 30 H(exp) (cm) 14 20 26 32 h (cm) 210 240 270 300 330 360 390 4201 H(exp) (cm) 38 39 39 401 60 40 40 90 120 150 180 34 35 36 37 40 40 Table 2: Initial Flowrate= 70LPH; Final Flowrate=90LPH t (s) h (cm) H(calc) (cm) t (s) h (cm) 180 H(calc) (cm) 0 H exp) (cm) 90 100 106 110 10 25 35 Hi exp) (cm) 135 136 137 138) 138 138 138 50 210 240 270 300 330 360 390 420 60 115 120 126 130 134) 90 138 120 150 138 (b) Impulse Change Table 3: Initial Flowrate=40L PH; Volume added = 500ml time time h h (cm) H (calc) H(exp) (cm) (cm) H(calc) (cm) H(exp) (cm) (s) (s) (cm) 0 24 28 2 92 26 74 20 30 66 150 180 210 240 270 300 330 360 45 54 26 25 24 24 24 60 48 36 90 120 30 24 Table 4: Initial Flowrate=50LPH: Volume added = 500ml time (s) h (cm) 44 H(calc) H (exp) (cm) (cm) H(calc) (cm) H (exp) (cm) 0 h (cm) 48 46 46 2 112 15 98 time (s) 150 180 210 240 270 300 330 360 30 86 45 44 45 76 60 67 44 90 58 44 120 50 44 (0) Complete the free energy diagram that shows how the AG" for the biosynthesis of acetylcholine from acetyl-CoA and choline can be derived from the AG" for these two hydrolysis reactions. Identify the AG" for each energy difference and label the products corresponding to each energy level acetyl Coat H40 Energy 1. Original Data (a) Step change Table 1: Initial Flowrate=30LPH; Final Flowrate = 50LPH t (s) H(calc) (cm) t (s) H(calc) (cm) h (cm) 0 15 30 H(exp) (cm) 14 20 26 32 h (cm) 210 240 270 300 330 360 390 4201 H(exp) (cm) 38 39 39 401 60 40 40 90 120 150 180 34 35 36 37 40 40 Table 2: Initial Flowrate= 70LPH; Final Flowrate=90LPH t (s) h (cm) H(calc) (cm) t (s) h (cm) 180 H(calc) (cm) 0 H exp) (cm) 90 100 106 110 10 25 35 Hi exp) (cm) 135 136 137 138) 138 138 138 50 210 240 270 300 330 360 390 420 60 115 120 126 130 134) 90 138 120 150 138 (b) Impulse Change Table 3: Initial Flowrate=40L PH; Volume added = 500ml time time h h (cm) H (calc) H(exp) (cm) (cm) H(calc) (cm) H(exp) (cm) (s) (s) (cm) 0 24 28 2 92 26 74 20 30 66 150 180 210 240 270 300 330 360 45 54 26 25 24 24 24 60 48 36 90 120 30 24 Table 4: Initial Flowrate=50LPH: Volume added = 500ml time (s) h (cm) 44 H(calc) H (exp) (cm) (cm) H(calc) (cm) H (exp) (cm) 0 h (cm) 48 46 46 2 112 15 98 time (s) 150 180 210 240 270 300 330 360 30 86 45 44 45 76 60 67 44 90 58 44 120 50 44 (0) Complete the free energy diagram that shows how the AG" for the biosynthesis of acetylcholine from acetyl-CoA and choline can be derived from the AG" for these two hydrolysis reactions. Identify the AG" for each energy difference and label the products corresponding to each energy level acetyl Coat H40 Energy
Step by Step Solution
There are 3 Steps involved in it

Get step-by-step solutions from verified subject matter experts