

Question: Fault tree analysis is used to graphically represent the logic for fault conditions to be analysed. Figure 3-1 gives a fault tree for a top
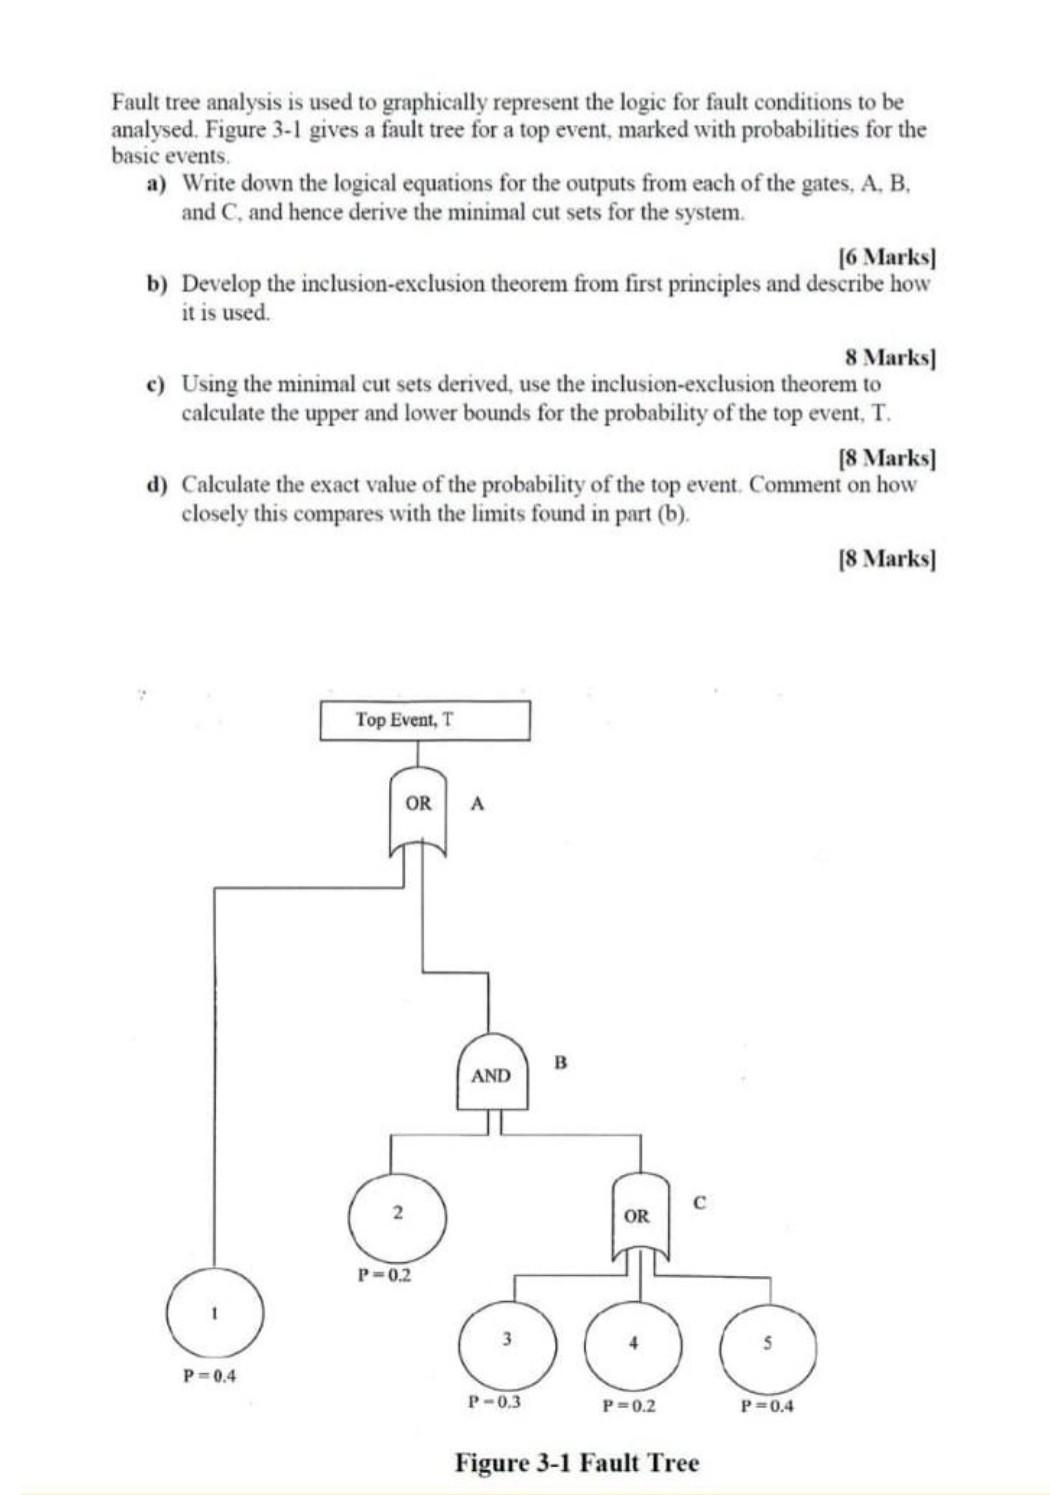
Fault tree analysis is used to graphically represent the logic for fault conditions to be analysed. Figure 3-1 gives a fault tree for a top event, marked with probabilities for the basic events. a) Write down the logical equations for the outputs from each of the gates, A. B. and C, and hence derive the minimal cut sets for the system. [6 Marks] b) Develop the inclusion-exclusion theorem from first principles and describe how it is used. 8 Marks] c) Using the minimal cut sets derived, use the inclusion-exclusion theorem to calculate the upper and lower bounds for the probability of the top event, T. [8 Marks] d) Calculate the exact value of the probability of the top event. Comment on how closely this compares with the limits found in part (b). [8 Marks] Top Event, T OR P=0.4 2 P=0.2 A AND B C OR 3 P-0.3 P=0.2 Figure 3-1 Fault Tree P=0.4 Fault tree analysis is used to graphically represent the logic for fault conditions to be analysed. Figure 3-1 gives a fault tree for a top event, marked with probabilities for the basic events. a) Write down the logical equations for the outputs from each of the gates, A. B. and C, and hence derive the minimal cut sets for the system. [6 Marks] b) Develop the inclusion-exclusion theorem from first principles and describe how it is used. 8 Marks] c) Using the minimal cut sets derived, use the inclusion-exclusion theorem to calculate the upper and lower bounds for the probability of the top event, T. [8 Marks] d) Calculate the exact value of the probability of the top event. Comment on how closely this compares with the limits found in part (b). [8 Marks] Top Event, T OR P=0.4 2 P=0.2 A AND B C OR 3 P-0.3 P=0.2 Figure 3-1 Fault Tree P=0.4
Step by Step Solution
There are 3 Steps involved in it

Get step-by-step solutions from verified subject matter experts