

Question: fb ). Compute the median value. C ). Compute the mode value. d). What is the shape of the distribution? e). Draw the histogram Draw
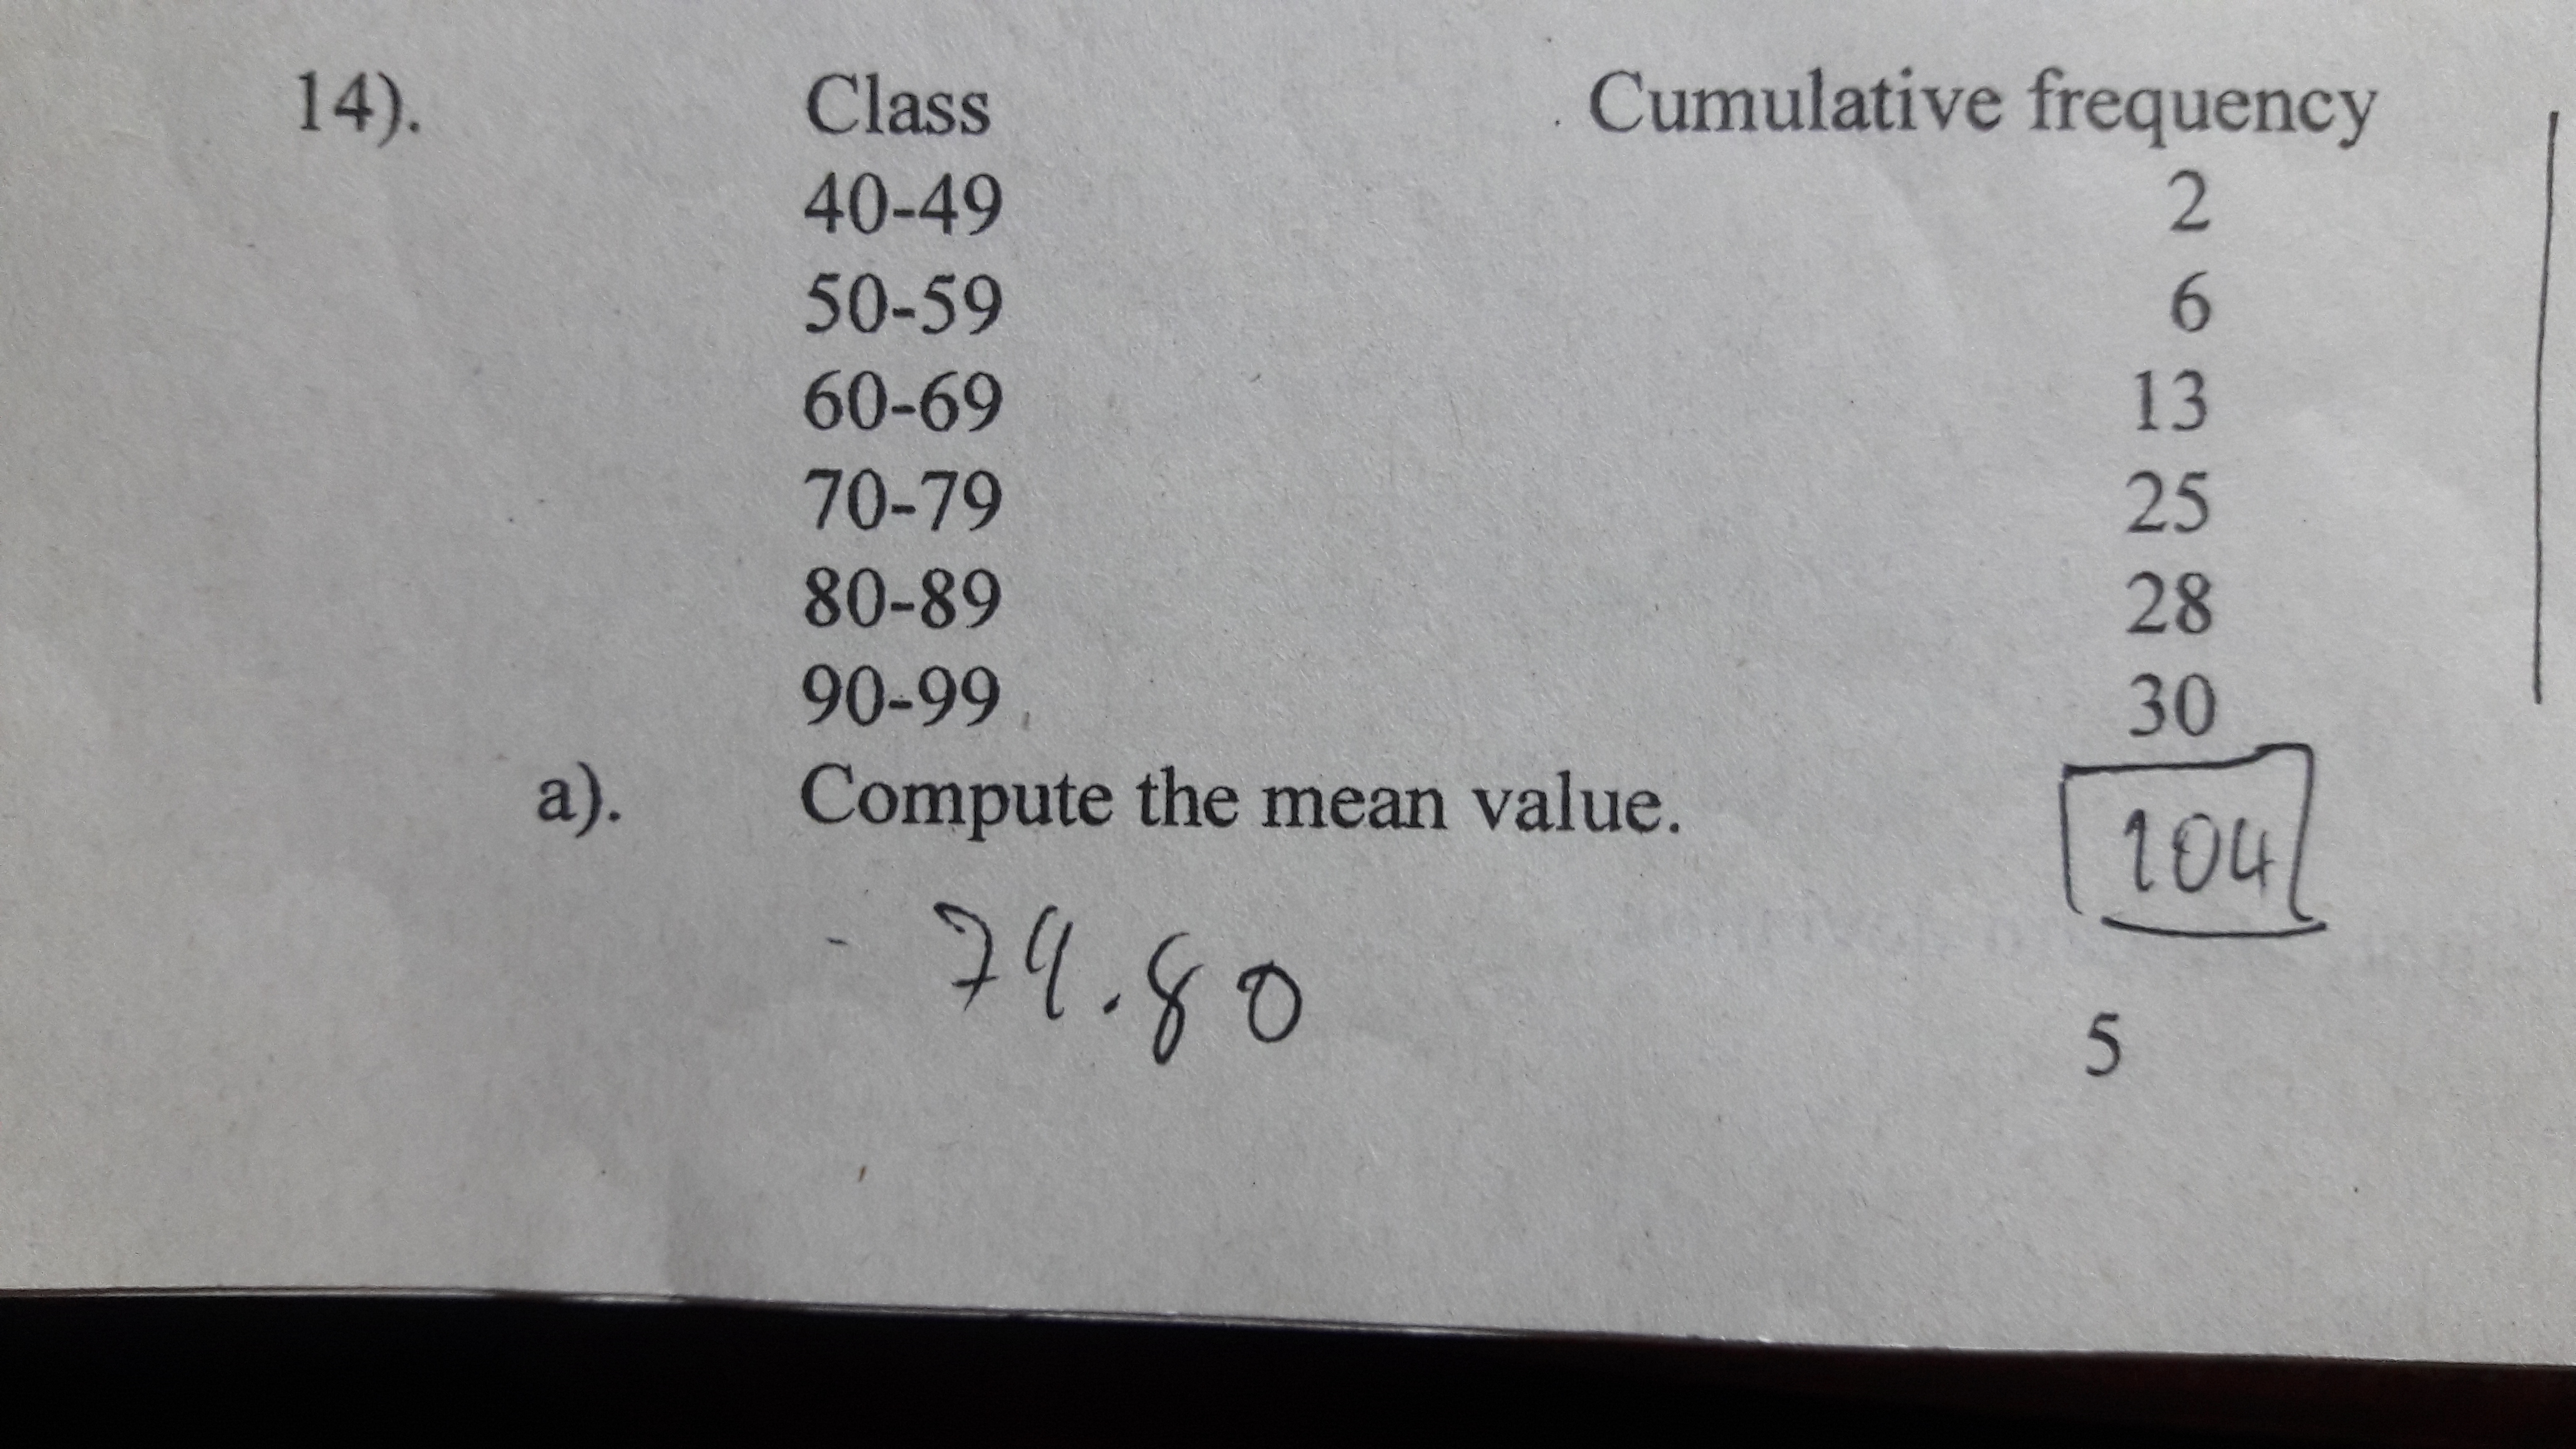
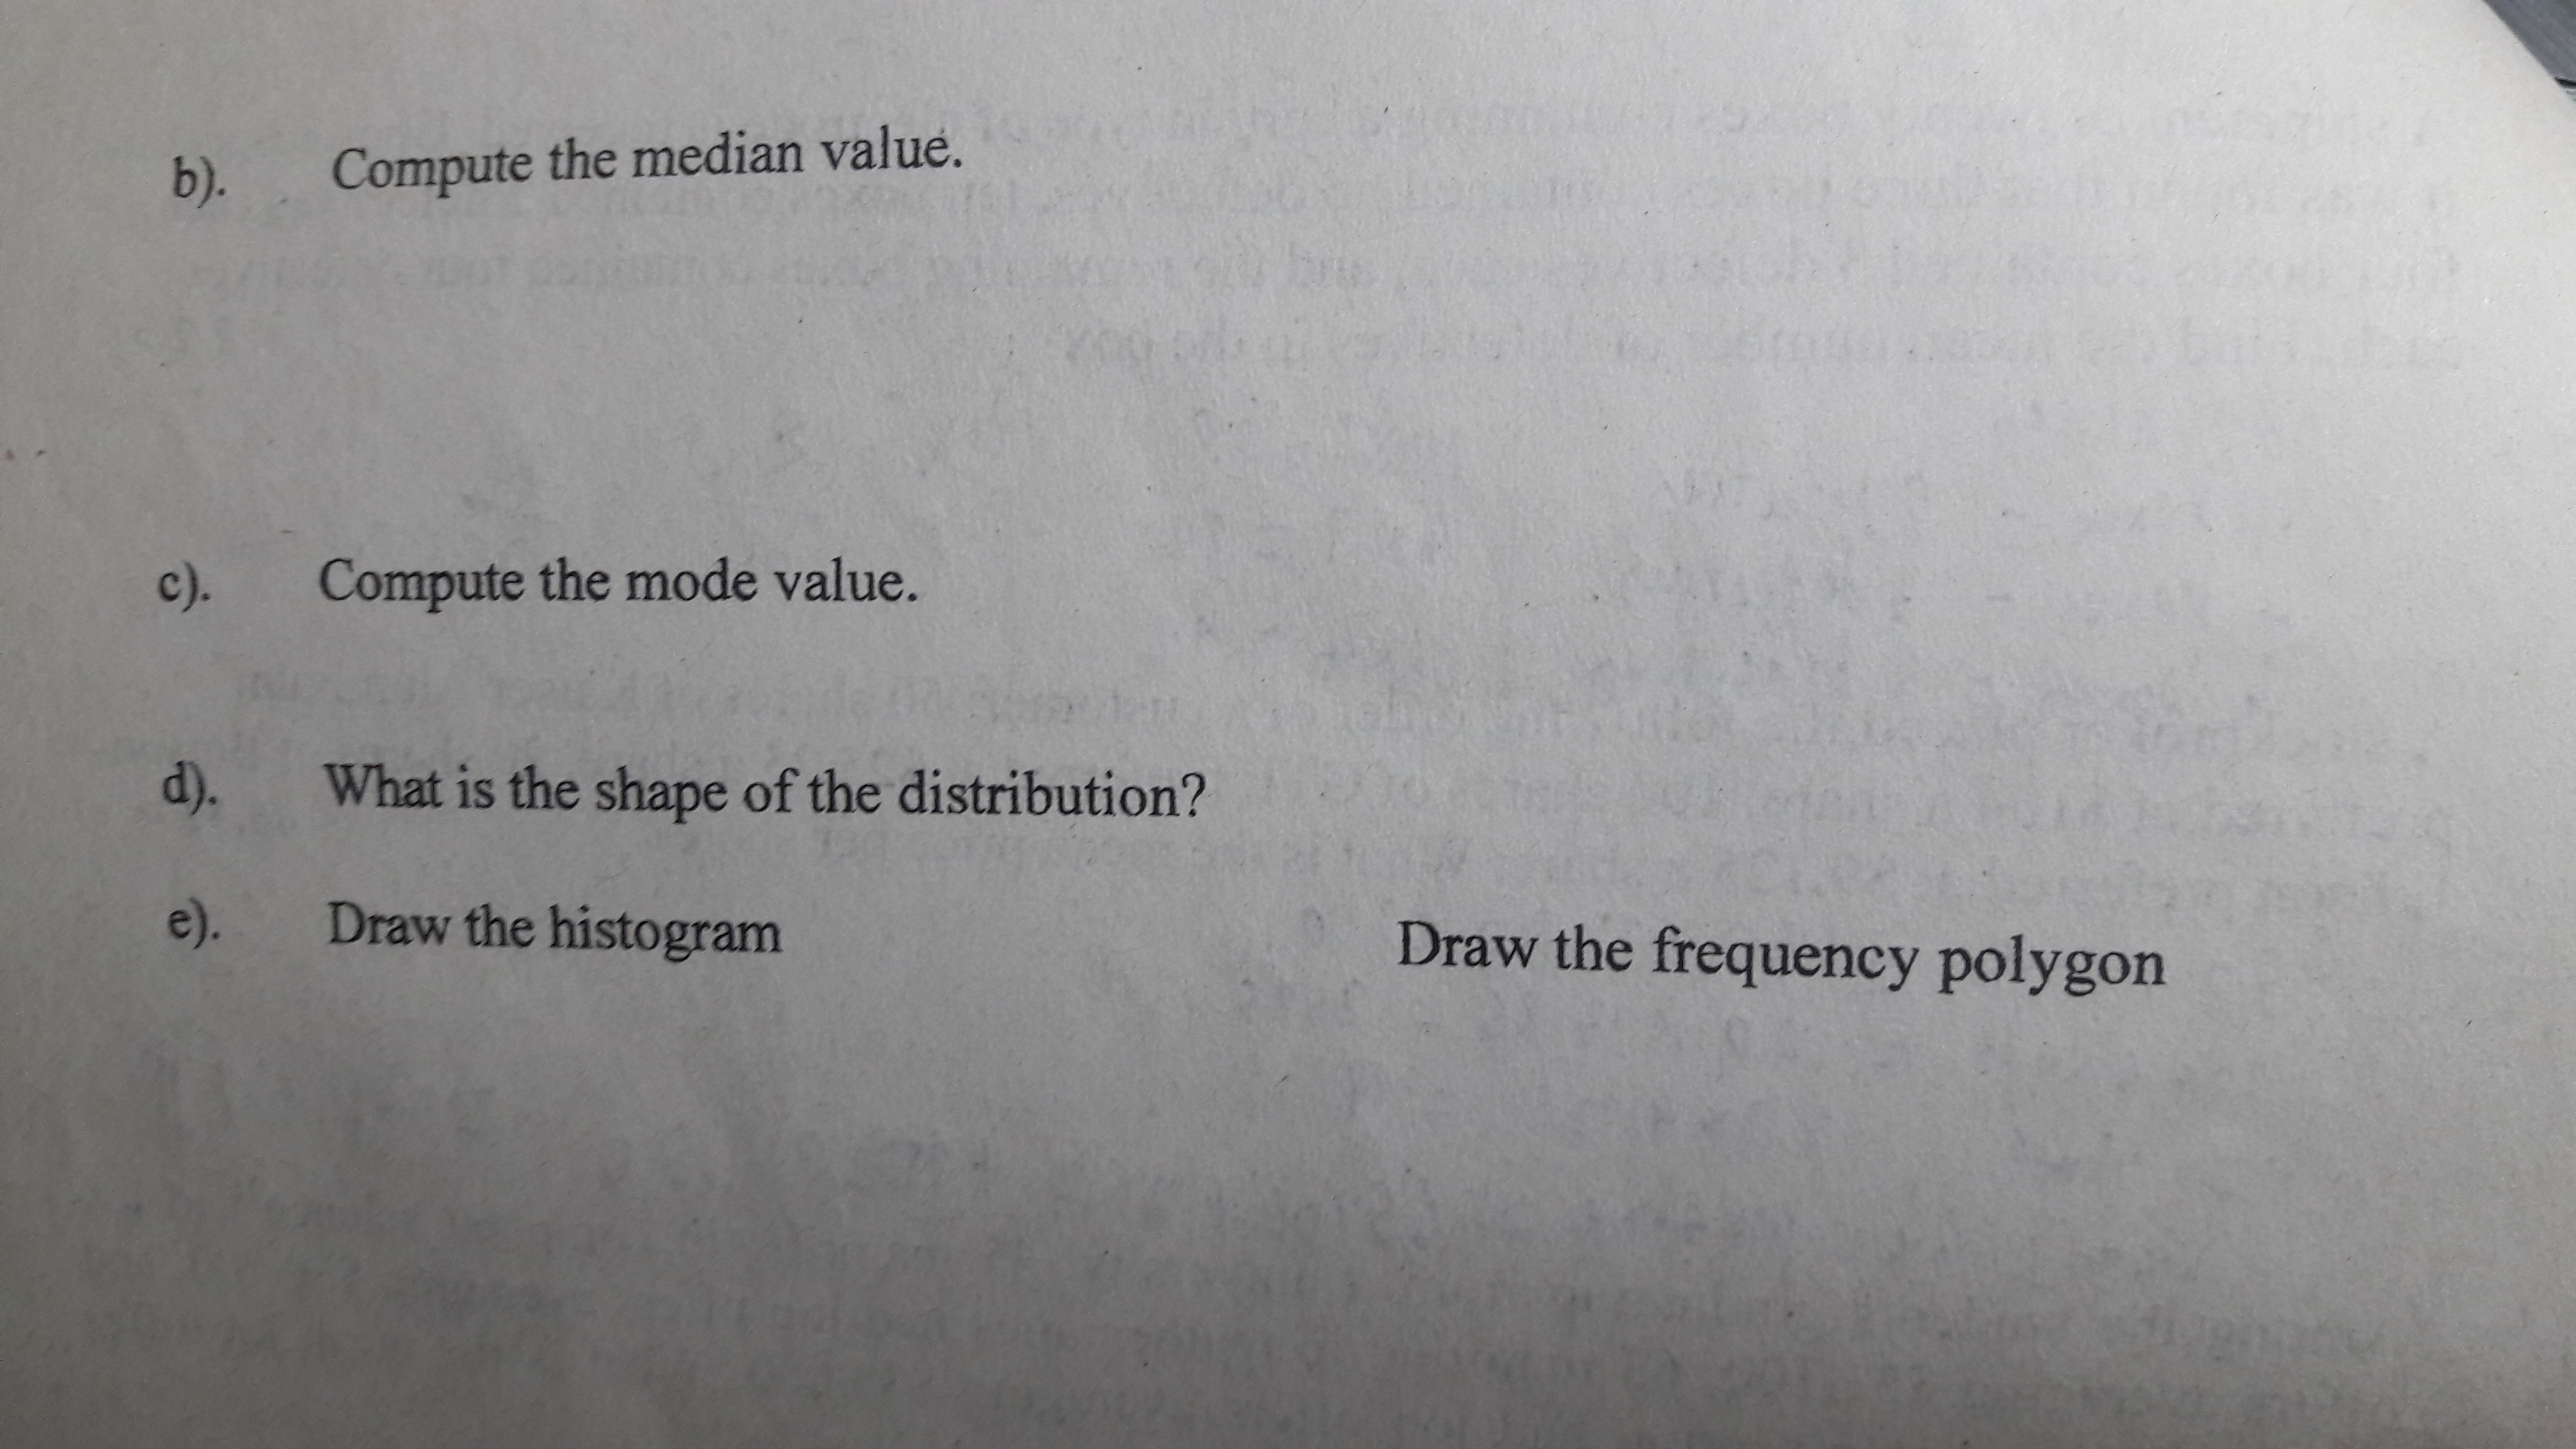
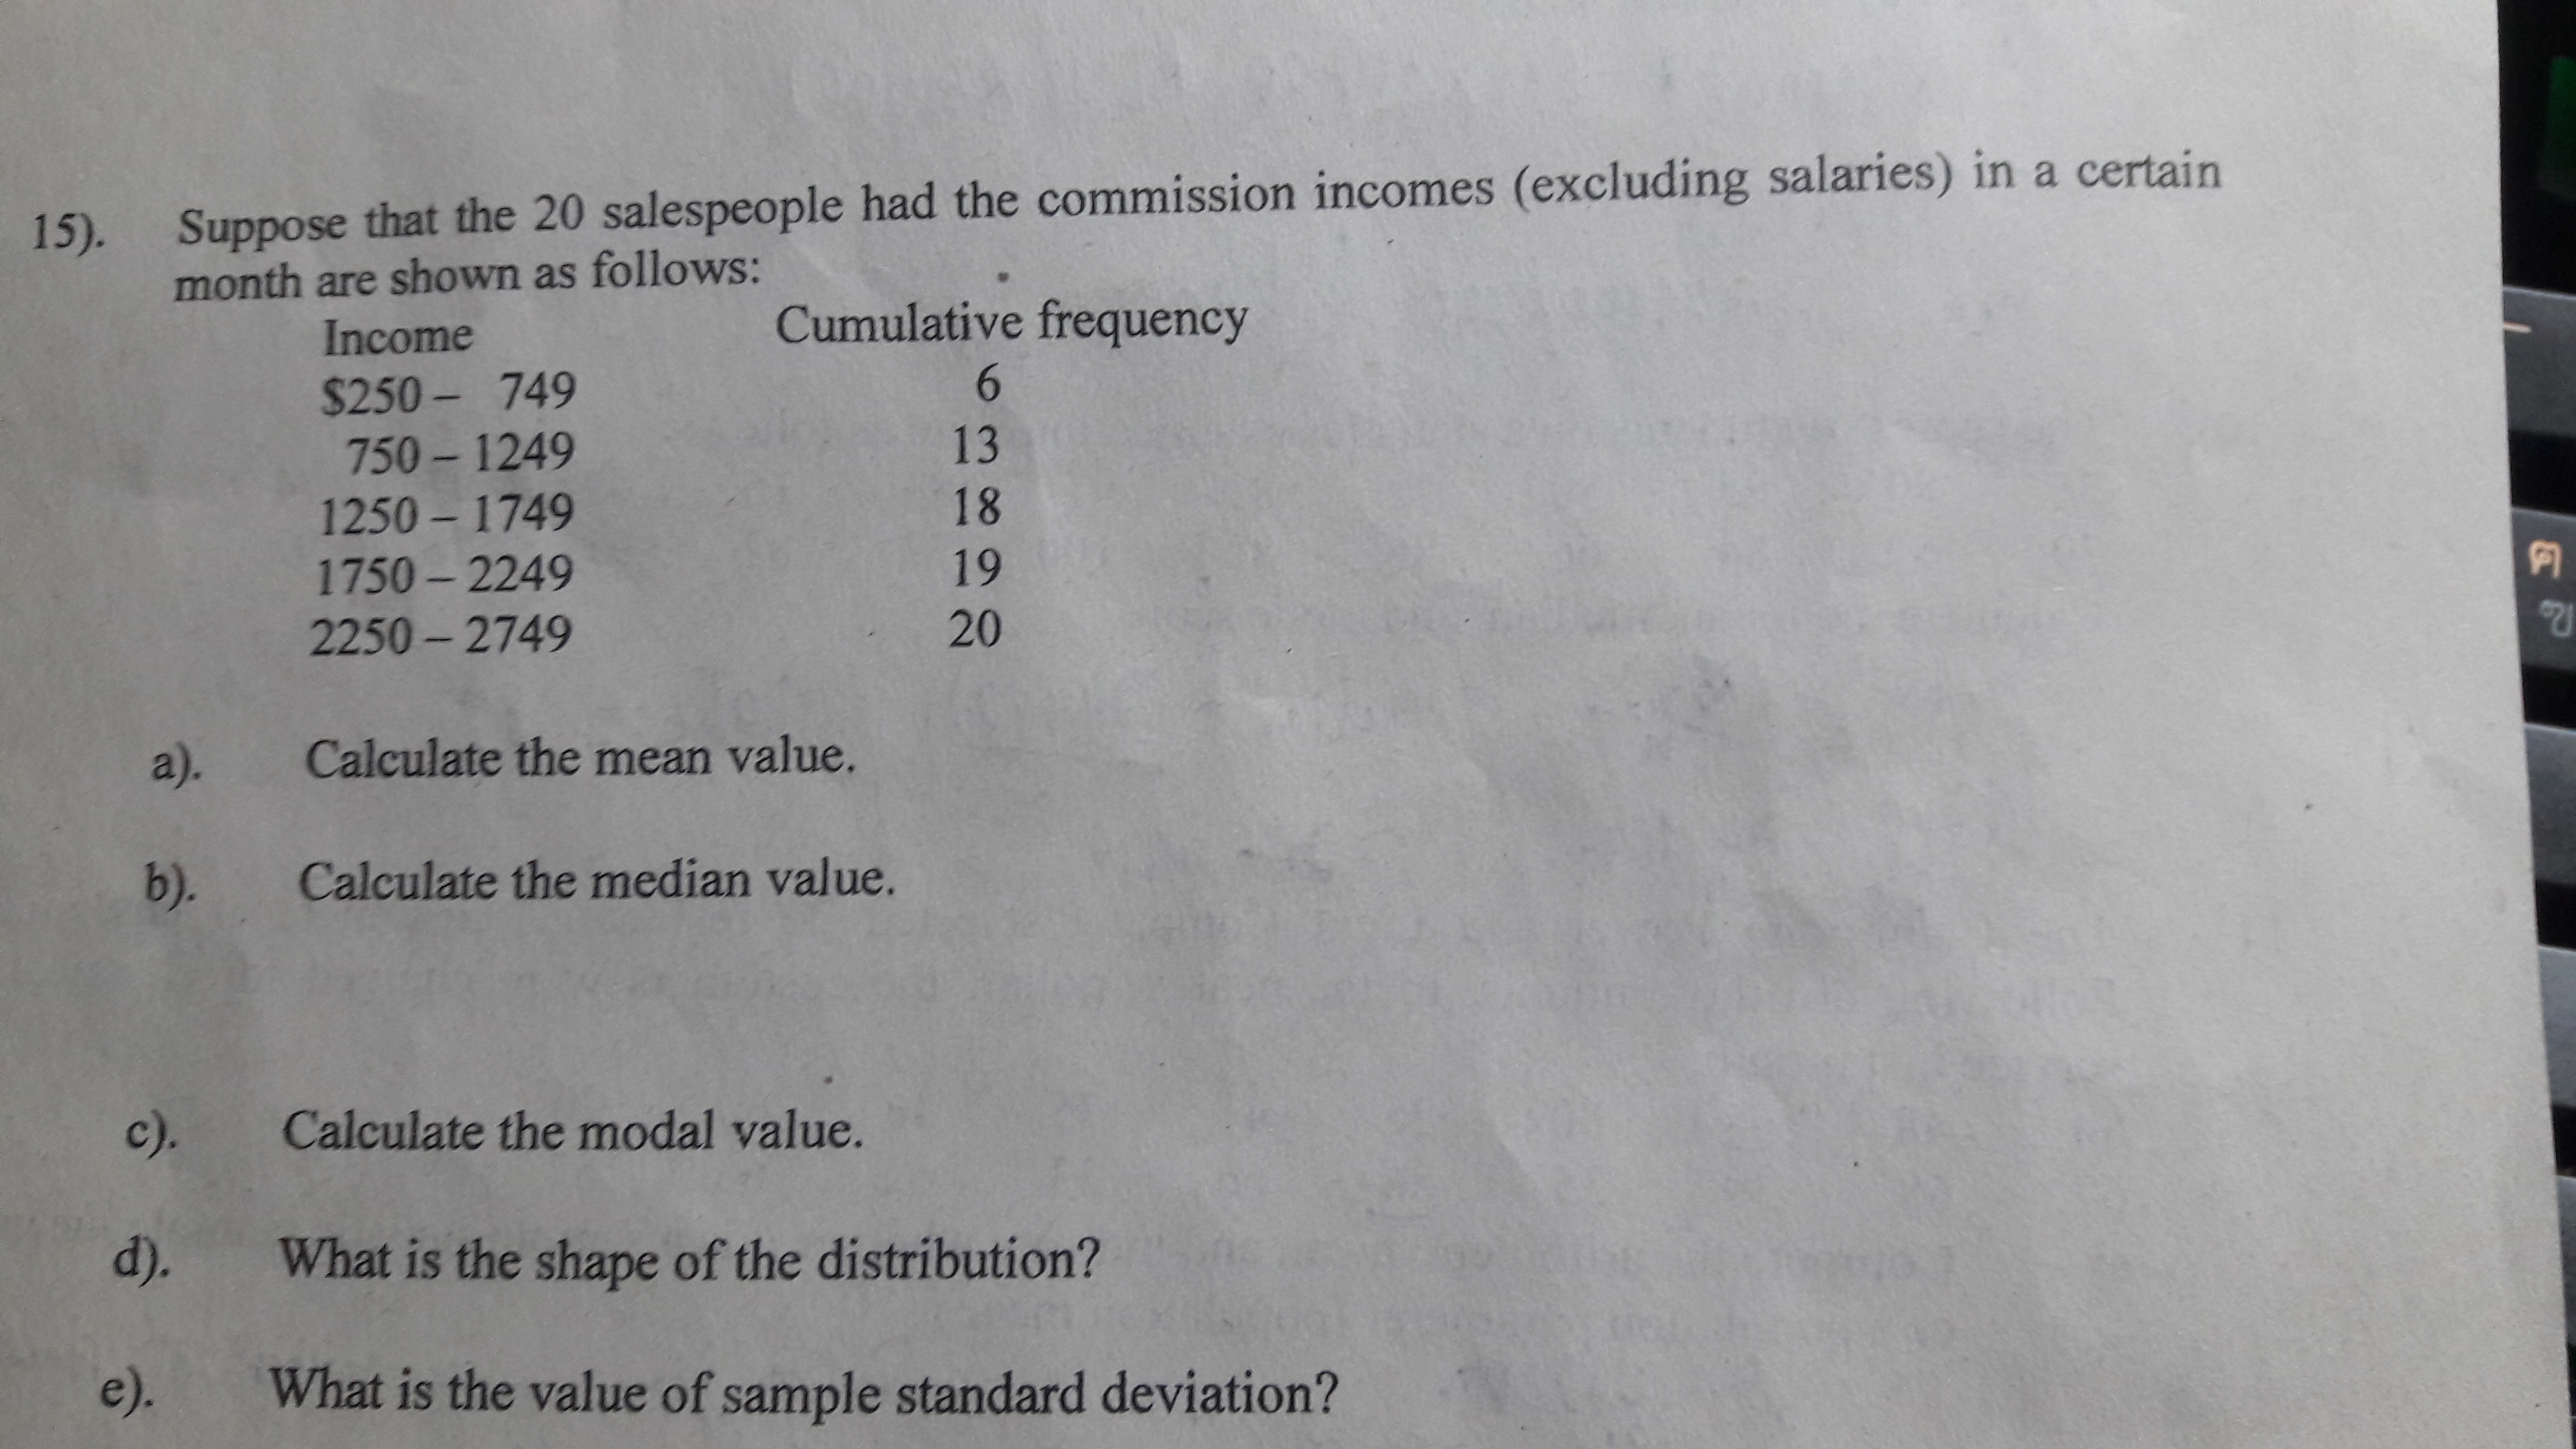
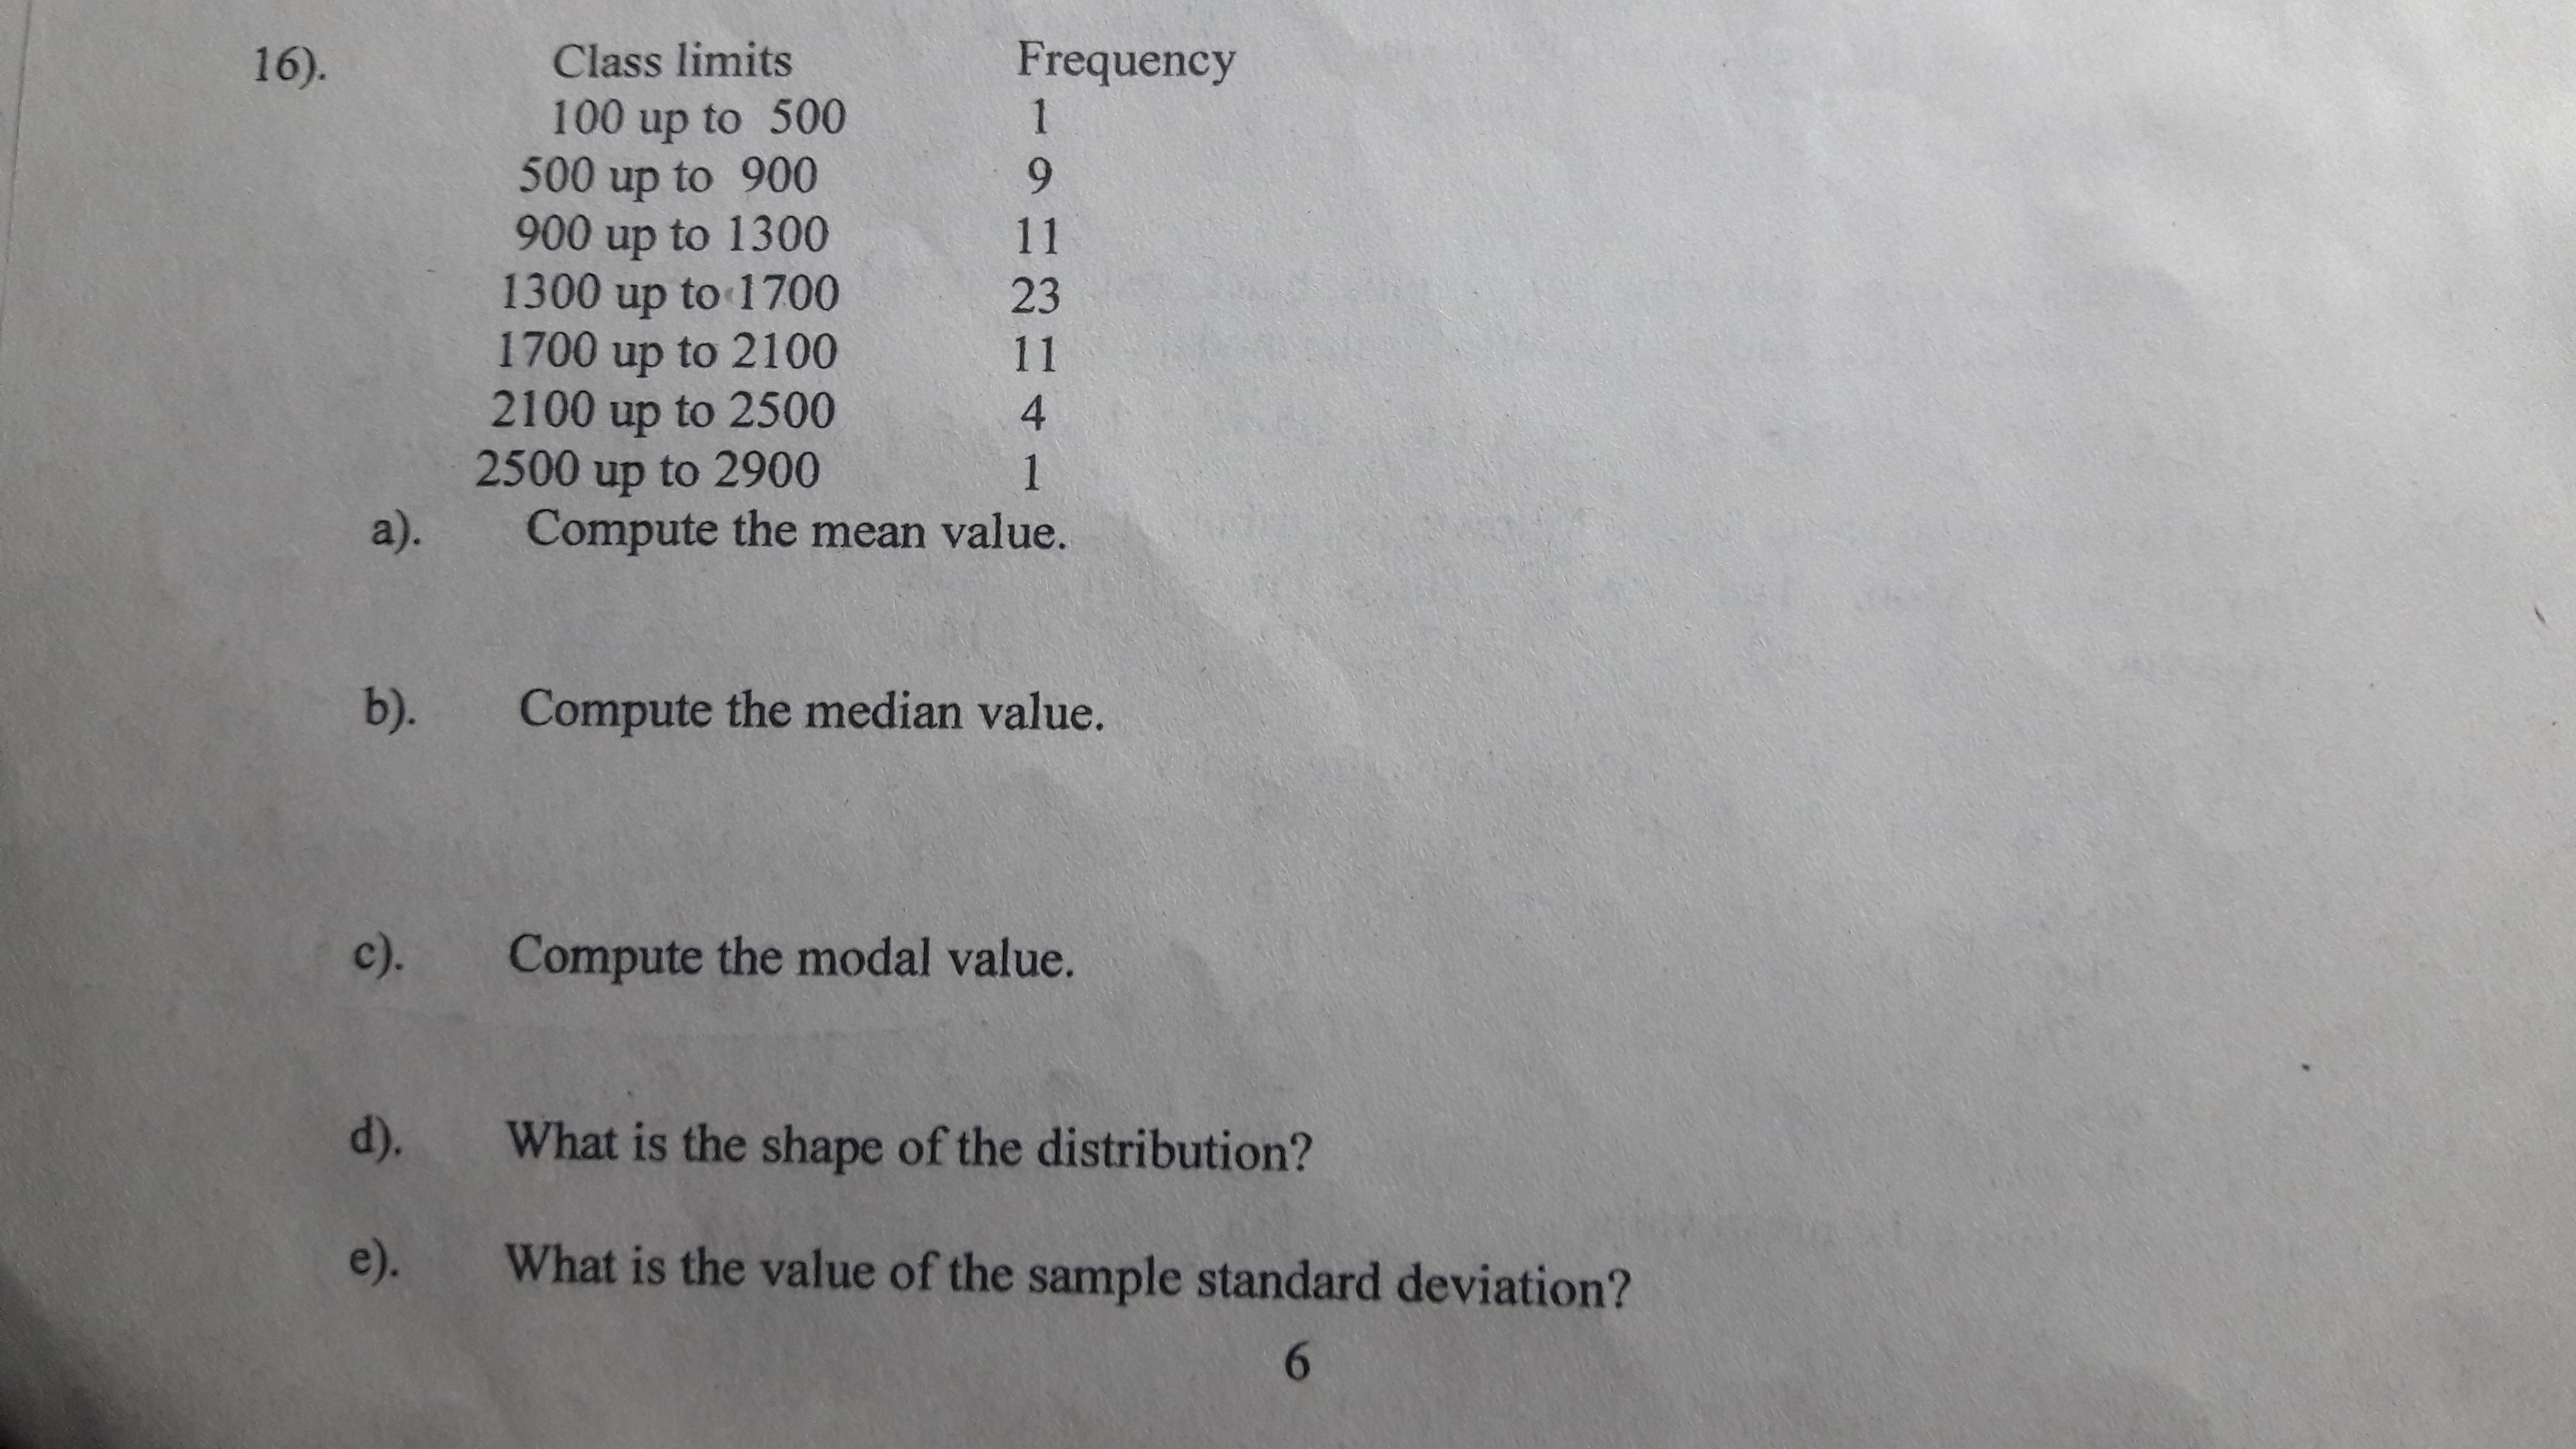
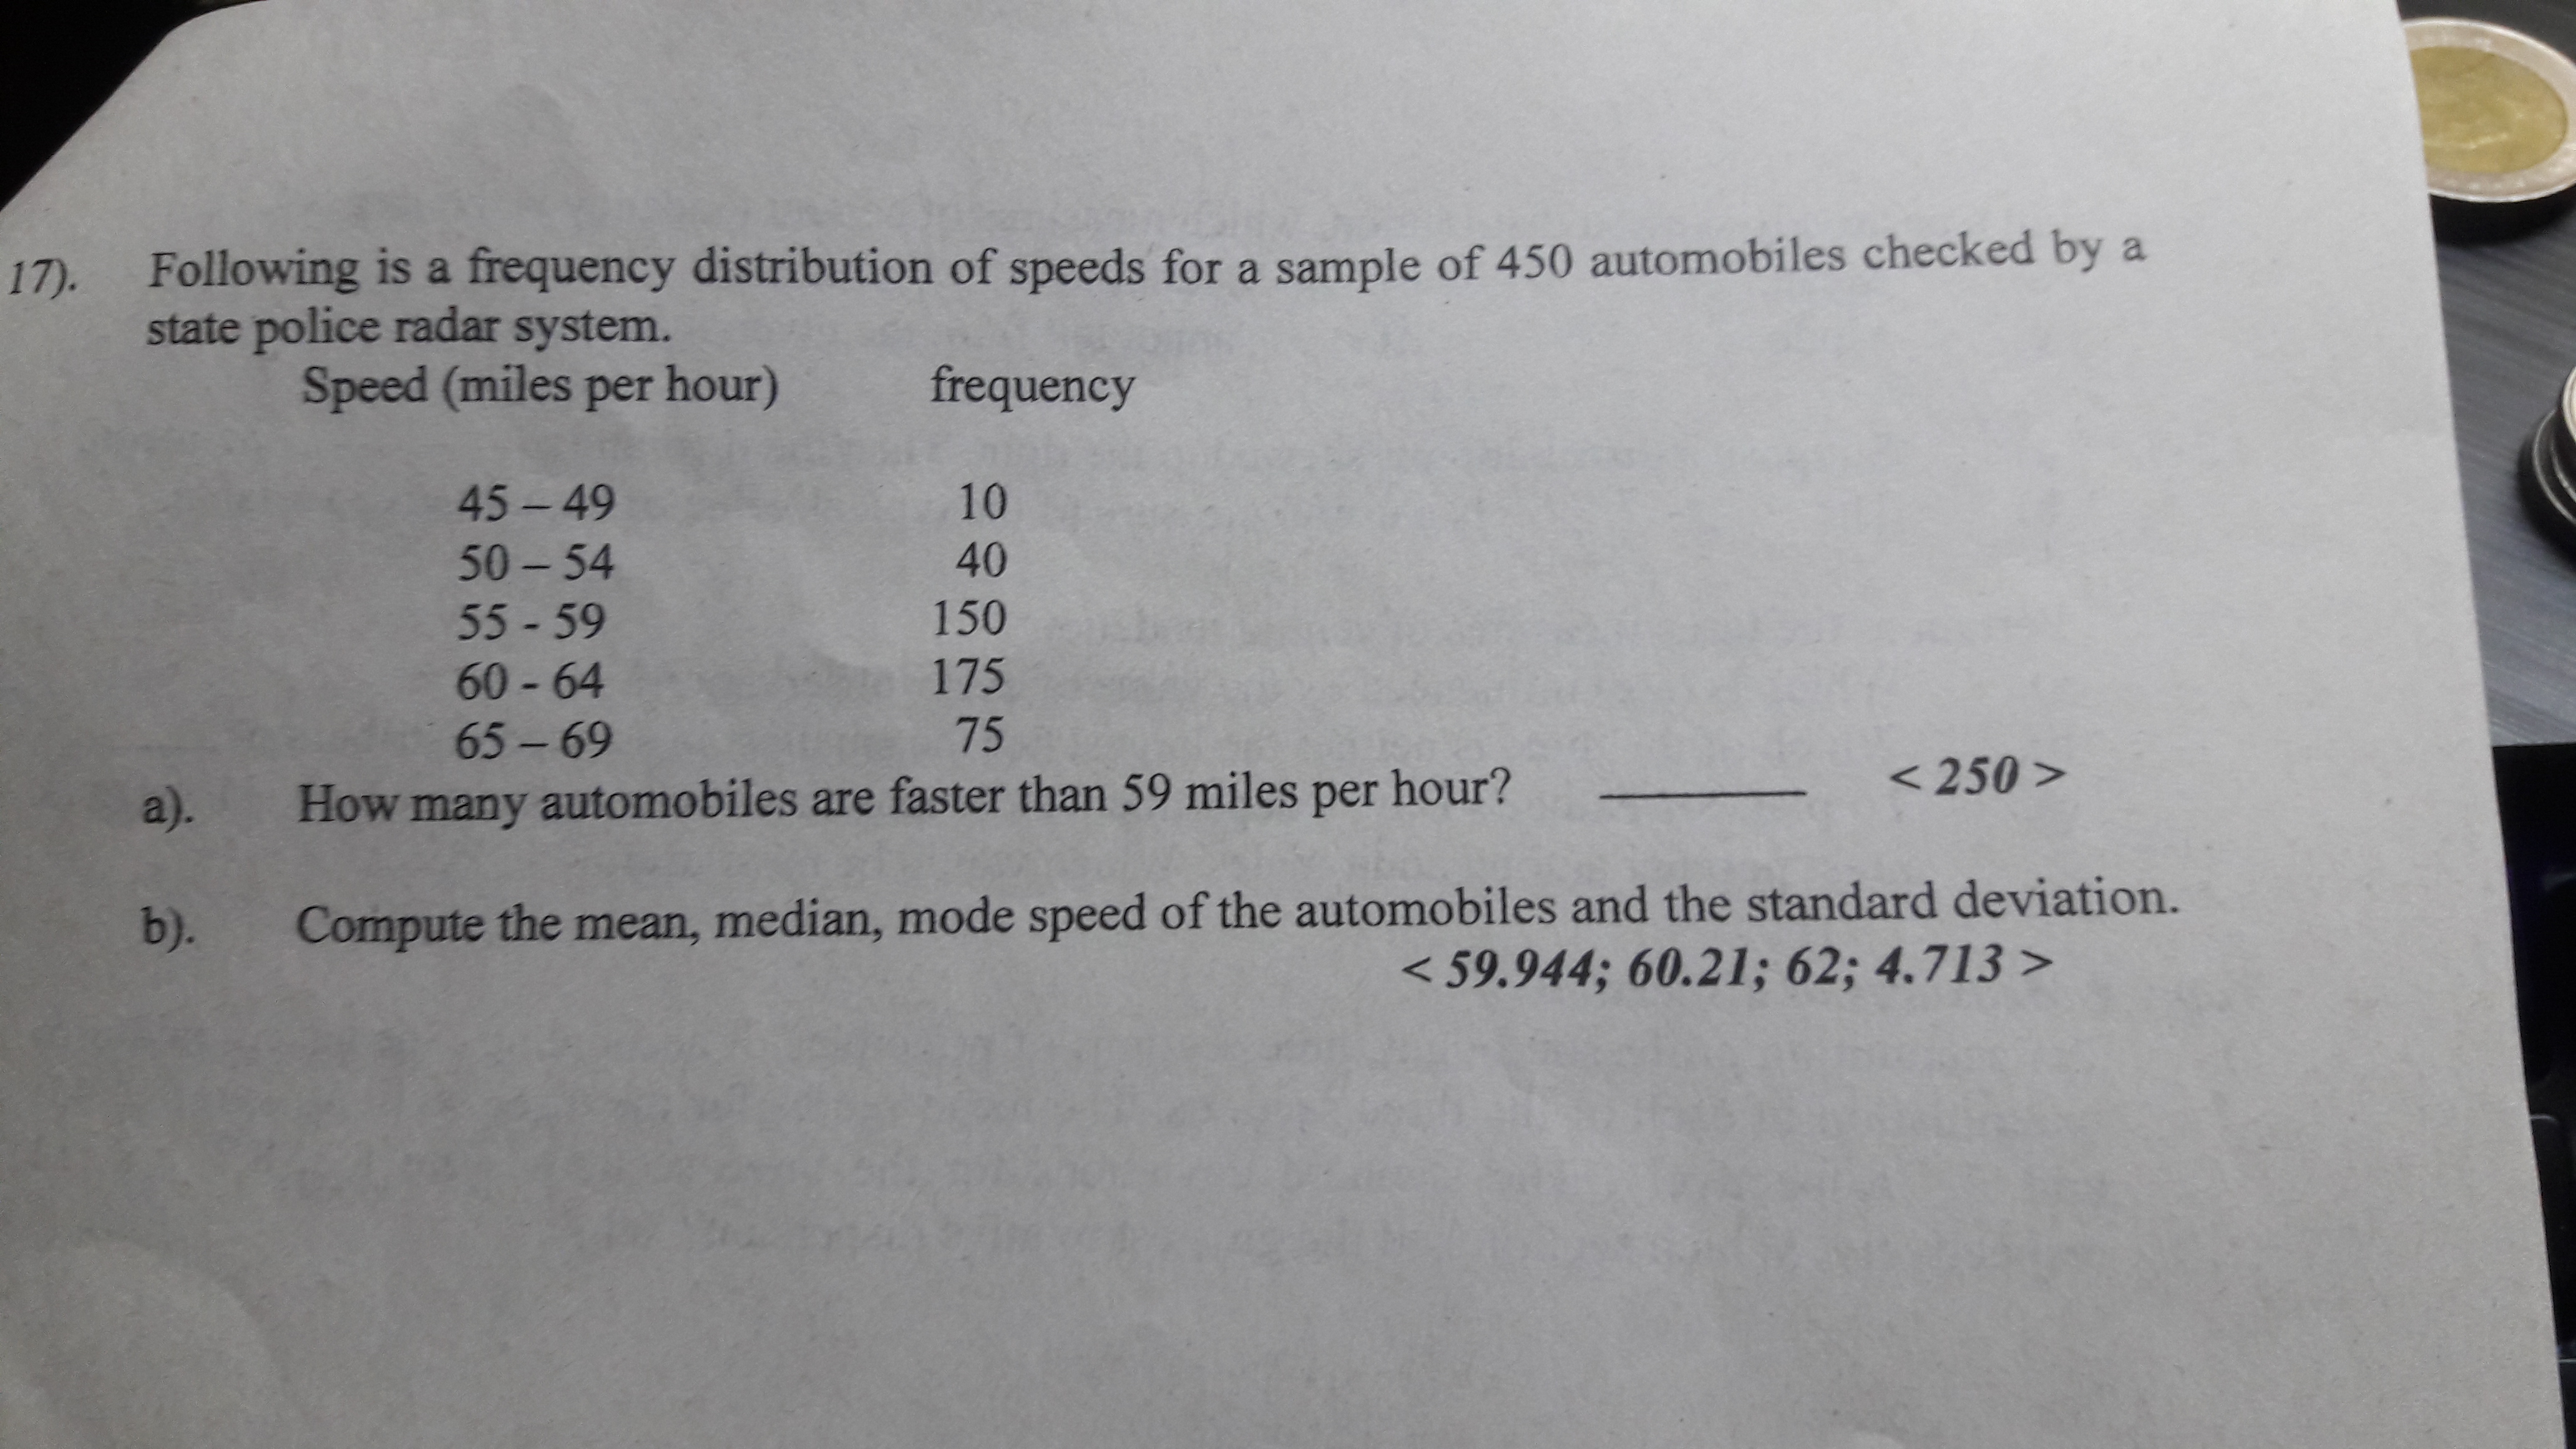
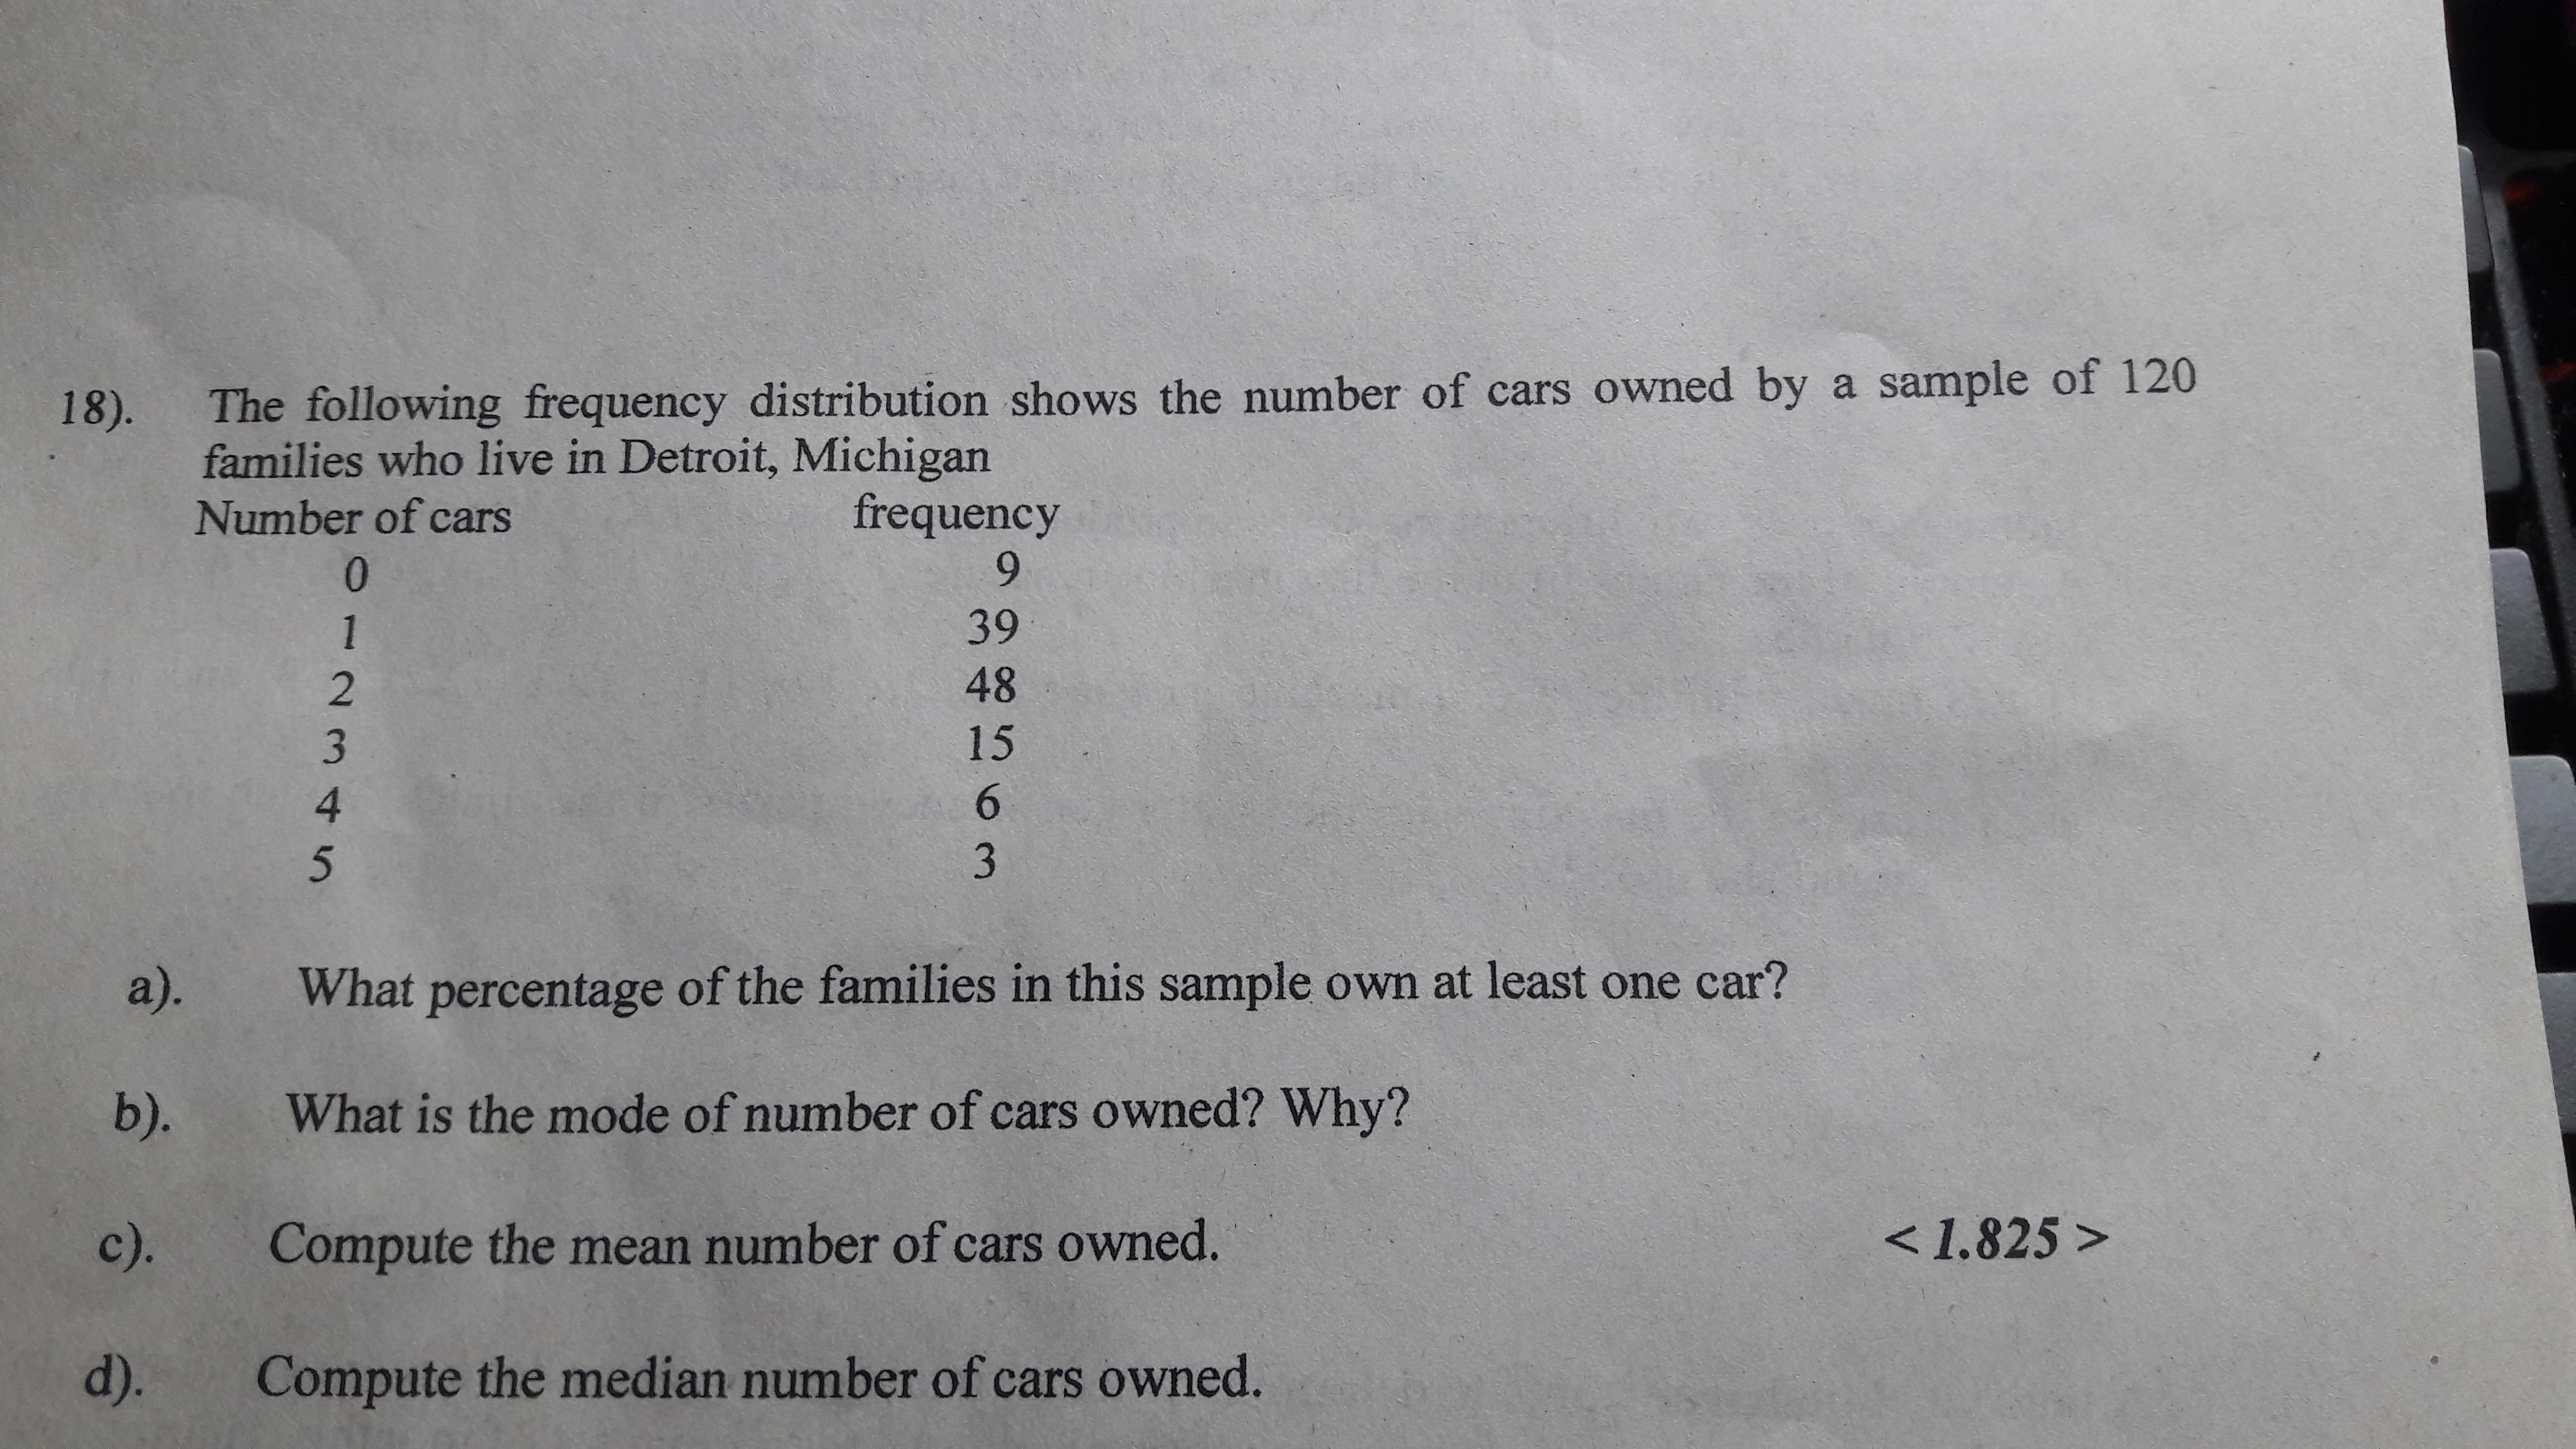
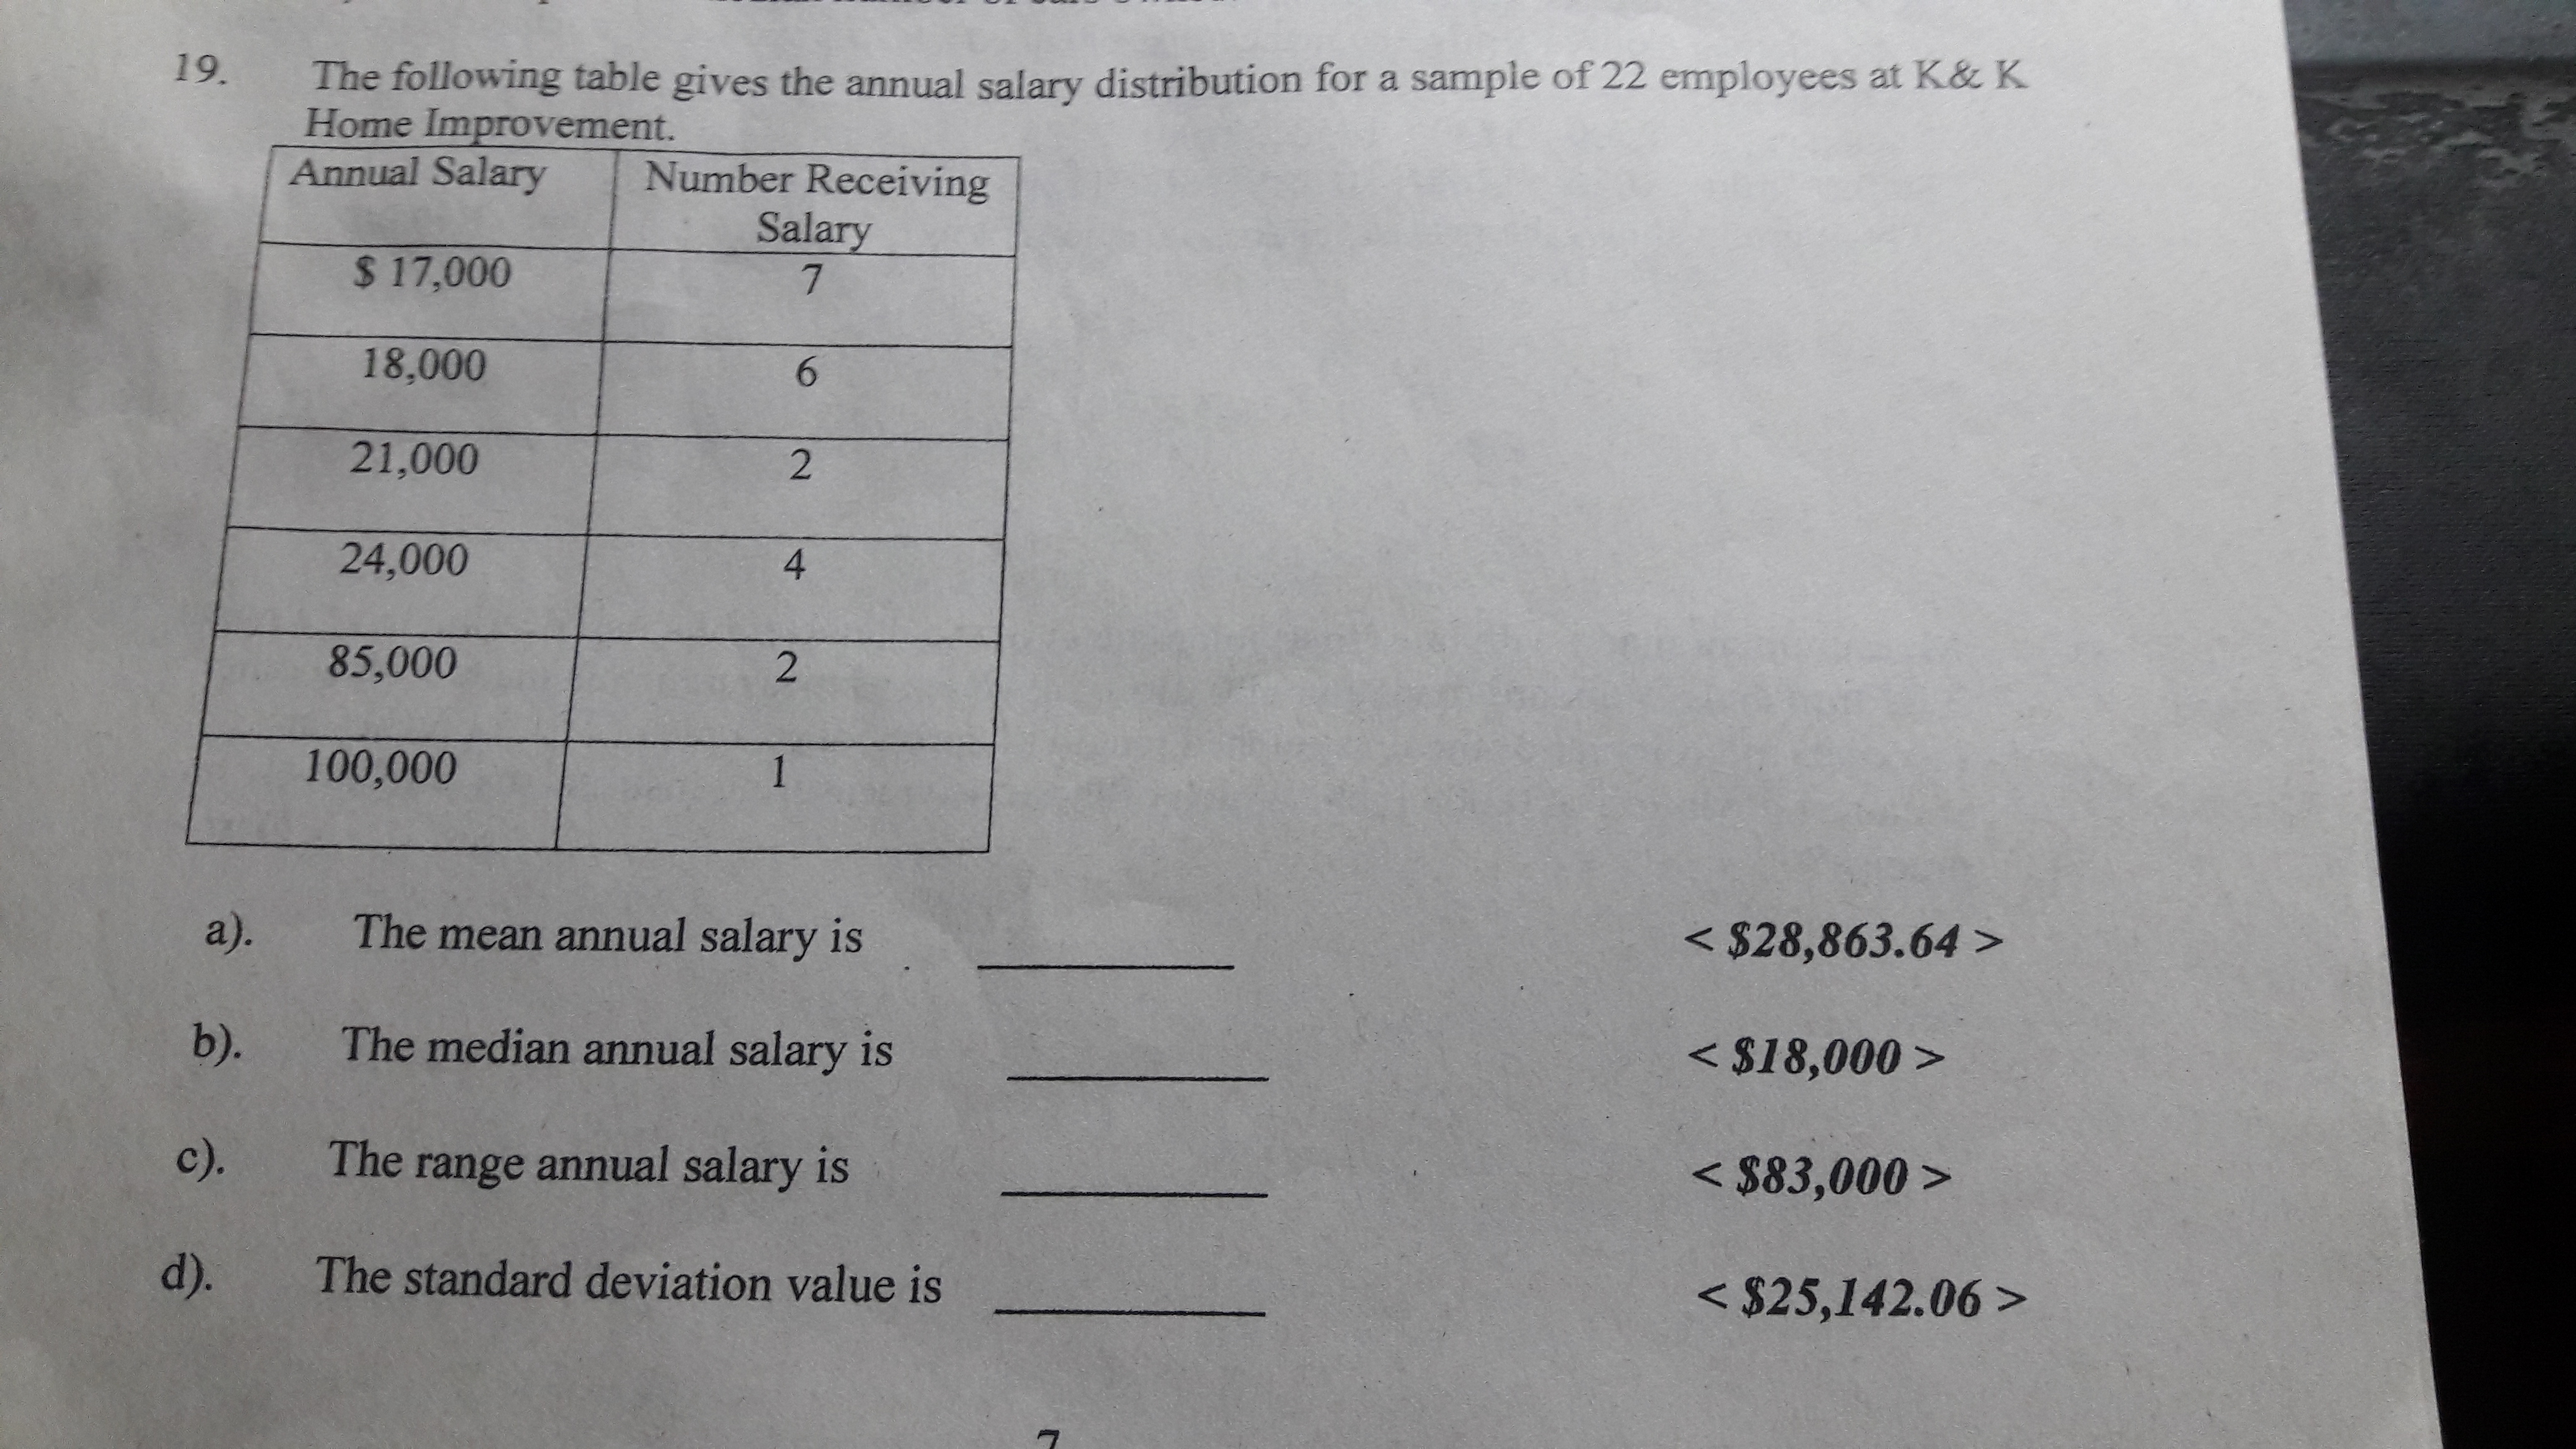
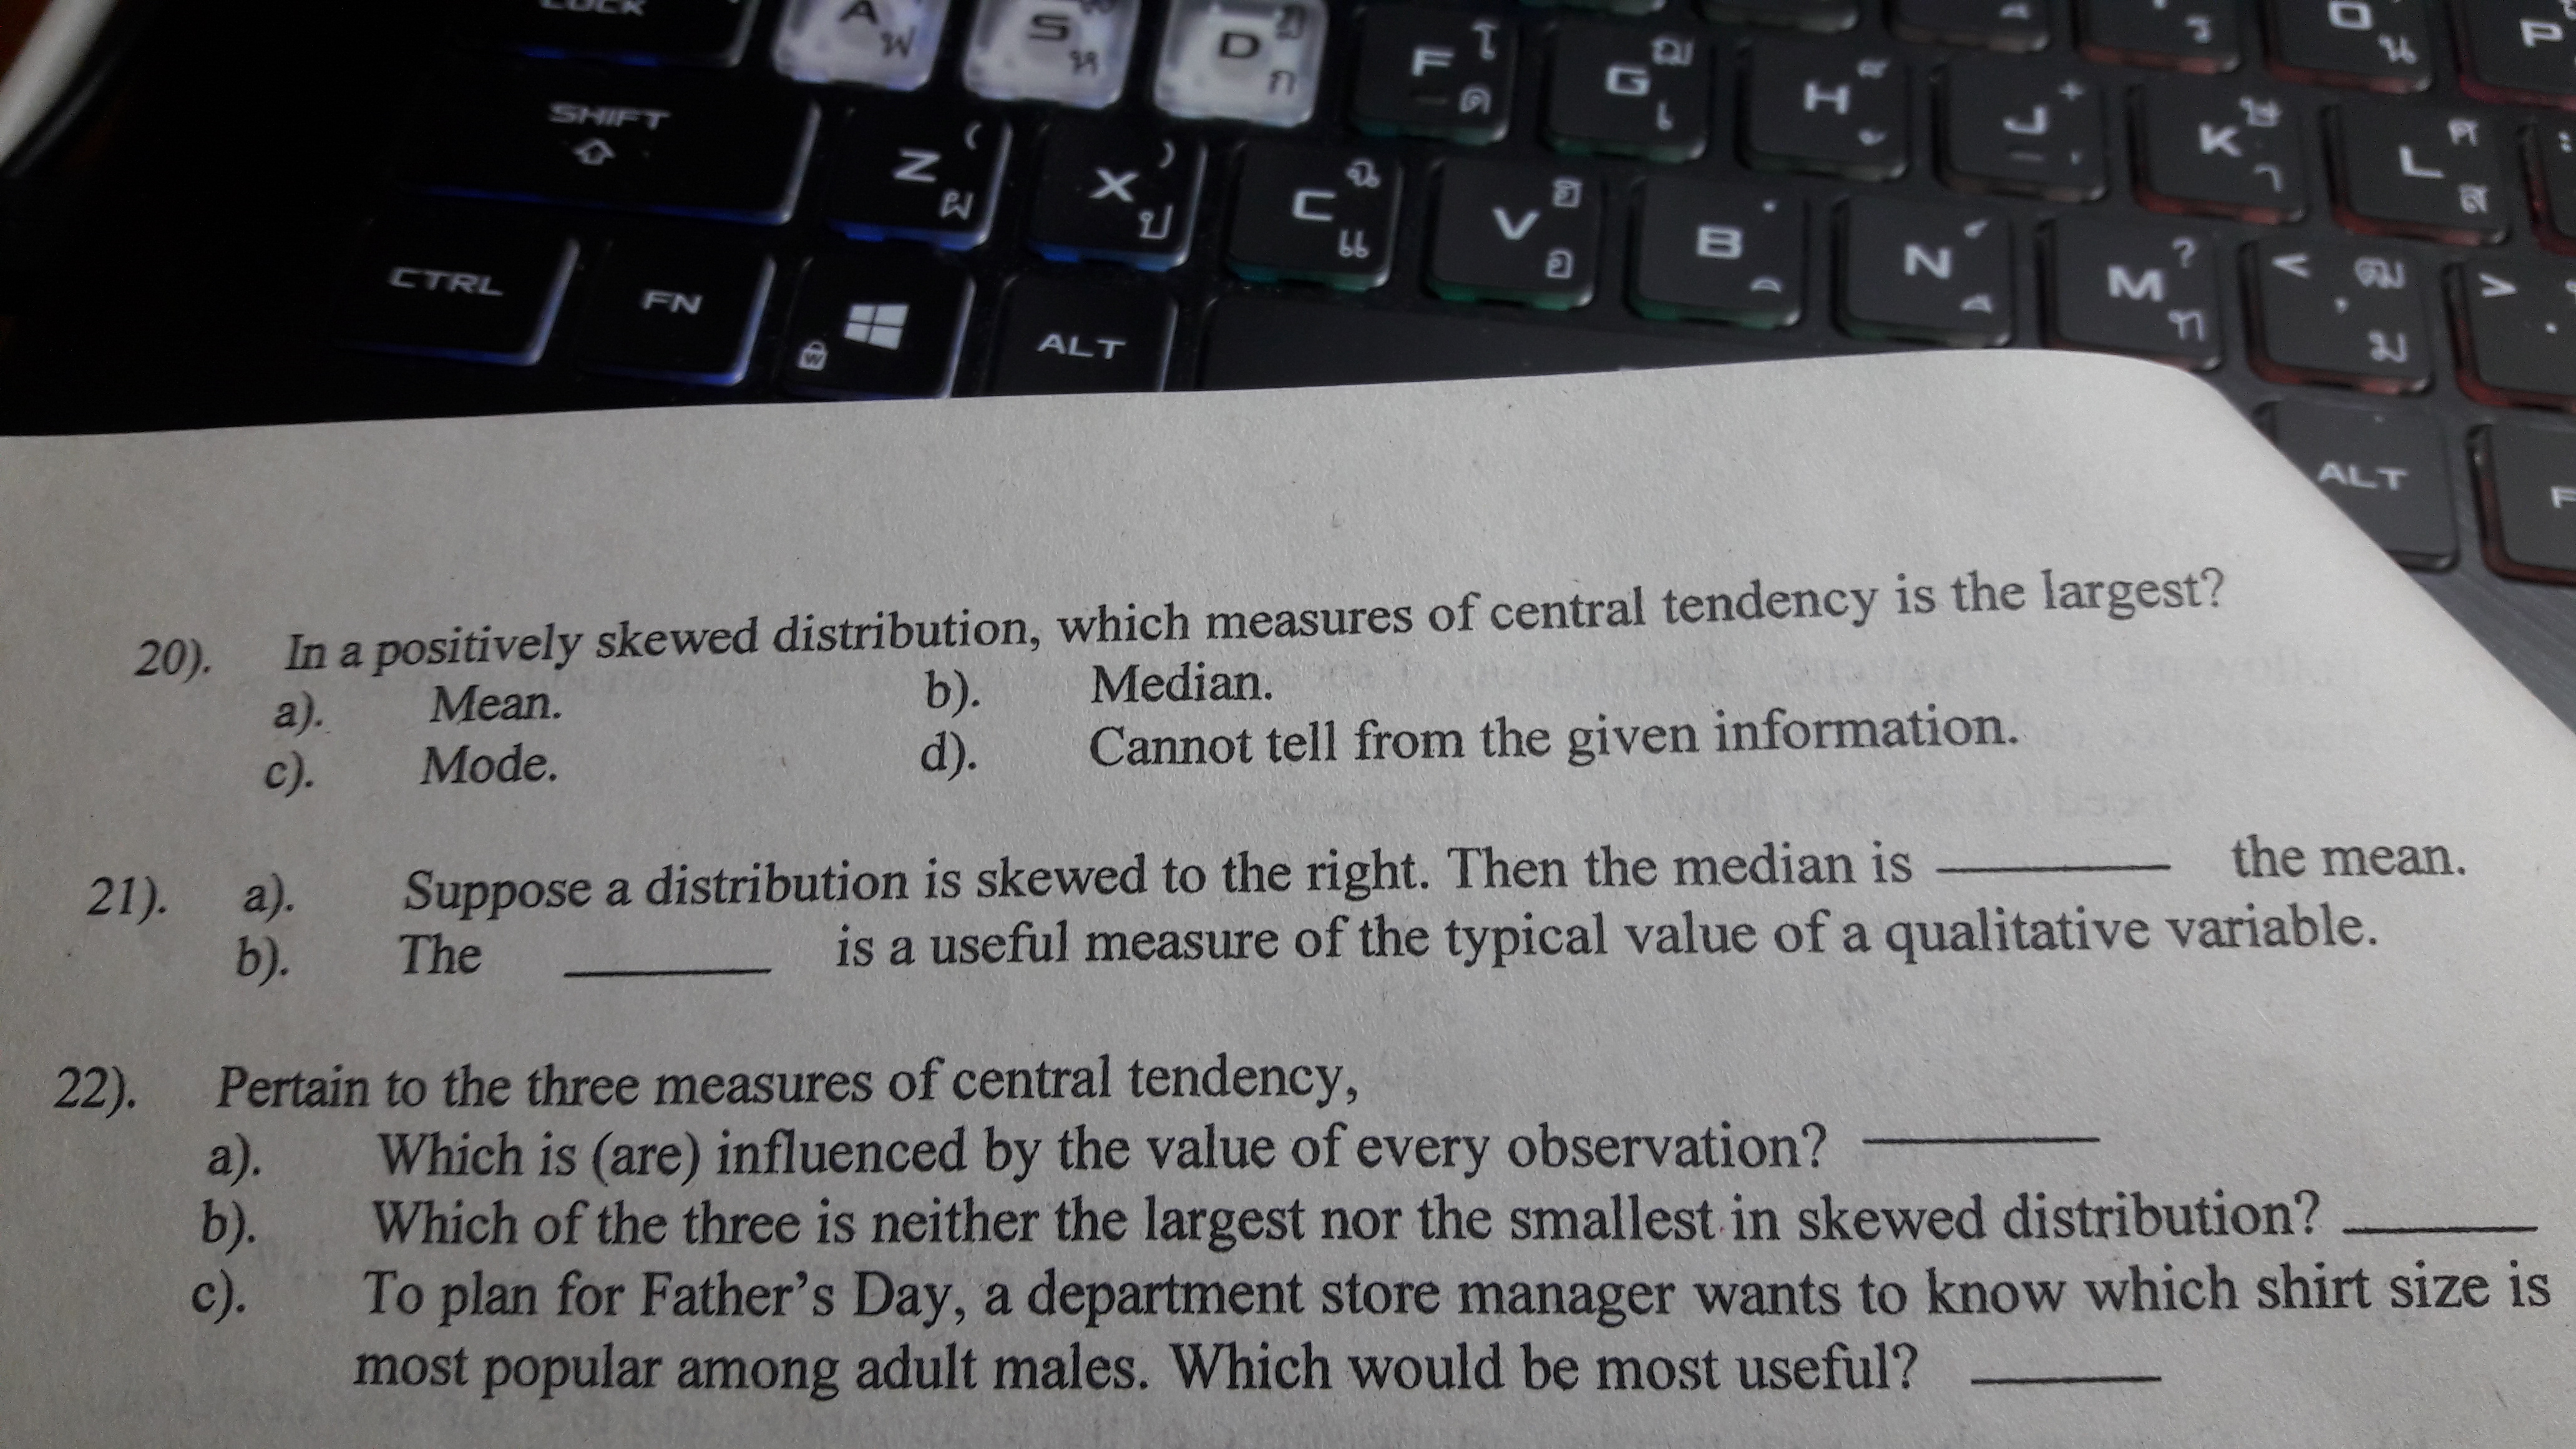
\fb ). Compute the median value. C ). Compute the mode value. d). What is the shape of the distribution? e). Draw the histogram Draw the frequency polygon15). Suppose that the 20 salespeople had the commission incomes (excluding salaries) in a certain month are shown as follows: Income Cumulative frequency $250 - 749 6 750-1249 13 1250 -1749 18 1750- 2249 19 2250-2749 20 a). Calculate the mean value. b ). Calculate the median value. c). Calculate the modal value. d). What is the shape of the distribution? e). What is the value of sample standard deviation?16). Class limits Frequency 100 up to 500 500 up to 900 9 900 up to 1300 11 1300 up to 1700 23 1700 up to 2100 11 2100 up to 2500 4 2500 up to 2900 a). Compute the mean value. b). Compute the median value. C). Compute the modal value. d). What is the shape of the distribution? e). What is the value of the sample standard deviation? 617). Following is a frequency distribution of speeds for a sample of 450 automobiles checked by a state police radar system. Speed (miles per hour) frequency 45 -49 10 50-54 40 55-59 150 60 - 64 175 65-69 75 a). How many automobiles are faster than 59 miles per hour? b ). . Compute the mean, median, mode speed of the automobiles and the standard deviation. 18). The following frequency distribution shows the number of cars owned by a sample of 120 families who live in Detroit, Michigan Number of cars frequency 9 39 48 UID WN-C 15 6 a). What percentage of the families in this sample own at least one car? b ) . What is the mode of number of cars owned? Why? c ) . Compute the mean number of cars owned. d). Compute the median number of cars owned.19. The following table gives the annual salary distribution for a sample of 22 employees at K& K Home Improvement. Annual Salary Number Receiving Salary $ 17,000 7 18,000 6 21,000 2 24,000 85,000 2 100,000 a). The mean annual salary is The median annual salary is 1 1 b ) . c). The range annual salary is d). The standard deviation value is 11 P W S D G H K SHIFT Z X C 66 N M CTRL FN ALT W ALT 20). In a positively skewed distribution, which measures of central tendency is the largest? Median. a ). Mean. b ) . d ). Cannot tell from the given information. C). Mode. the mean. Suppose a distribution is skewed to the right. Then the median is 21). a). is a useful measure of the typical value of a qualitative variable. b). The 22). Pertain to the three measures of central tendency, Which is (are) influenced by the value of every observation? a). Which of the three is neither the largest nor the smallest in skewed distribution? b). To plan for Father's Day, a department store manager wants to know which shirt size is C) most popular among adult males. Which would be most useful
Step by Step Solution
There are 3 Steps involved in it

Get step-by-step solutions from verified subject matter experts