

Question: fC. Use table2 to draw Force (X-axis) vs Acceleration (Y-axis) graph then answer the following: 1. Write the proportional relationship between acceleration and Applied Force.
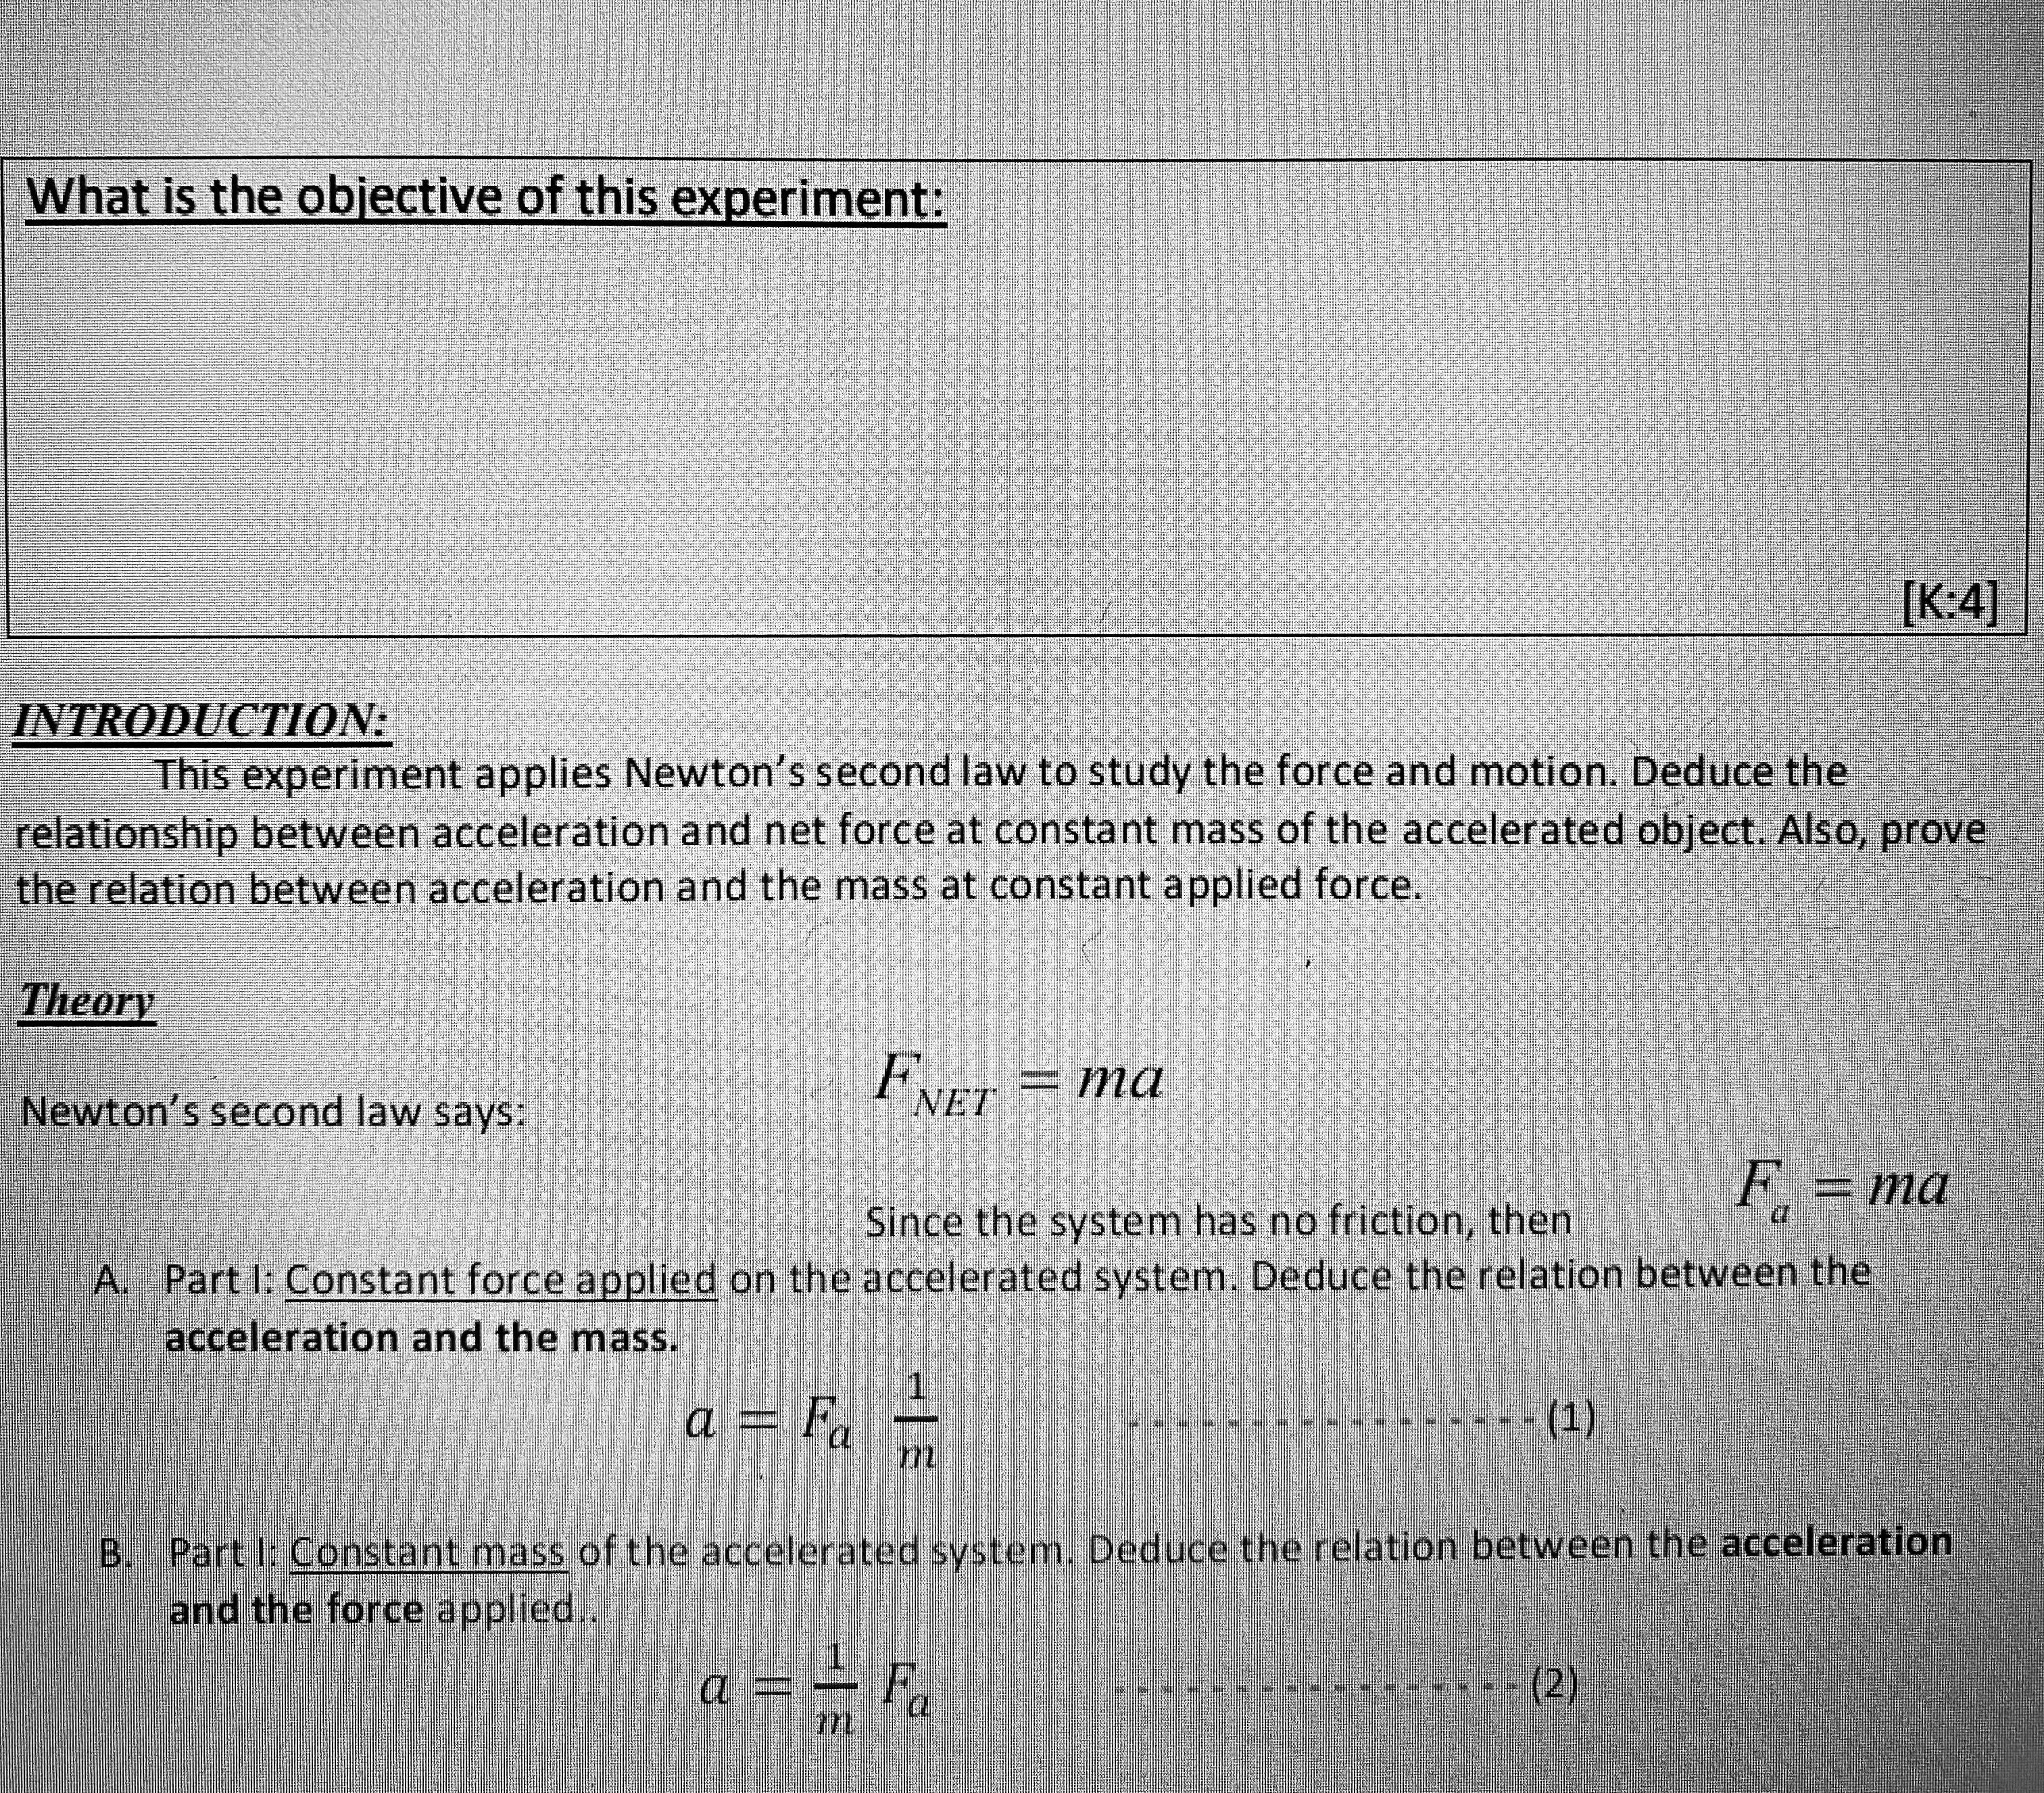
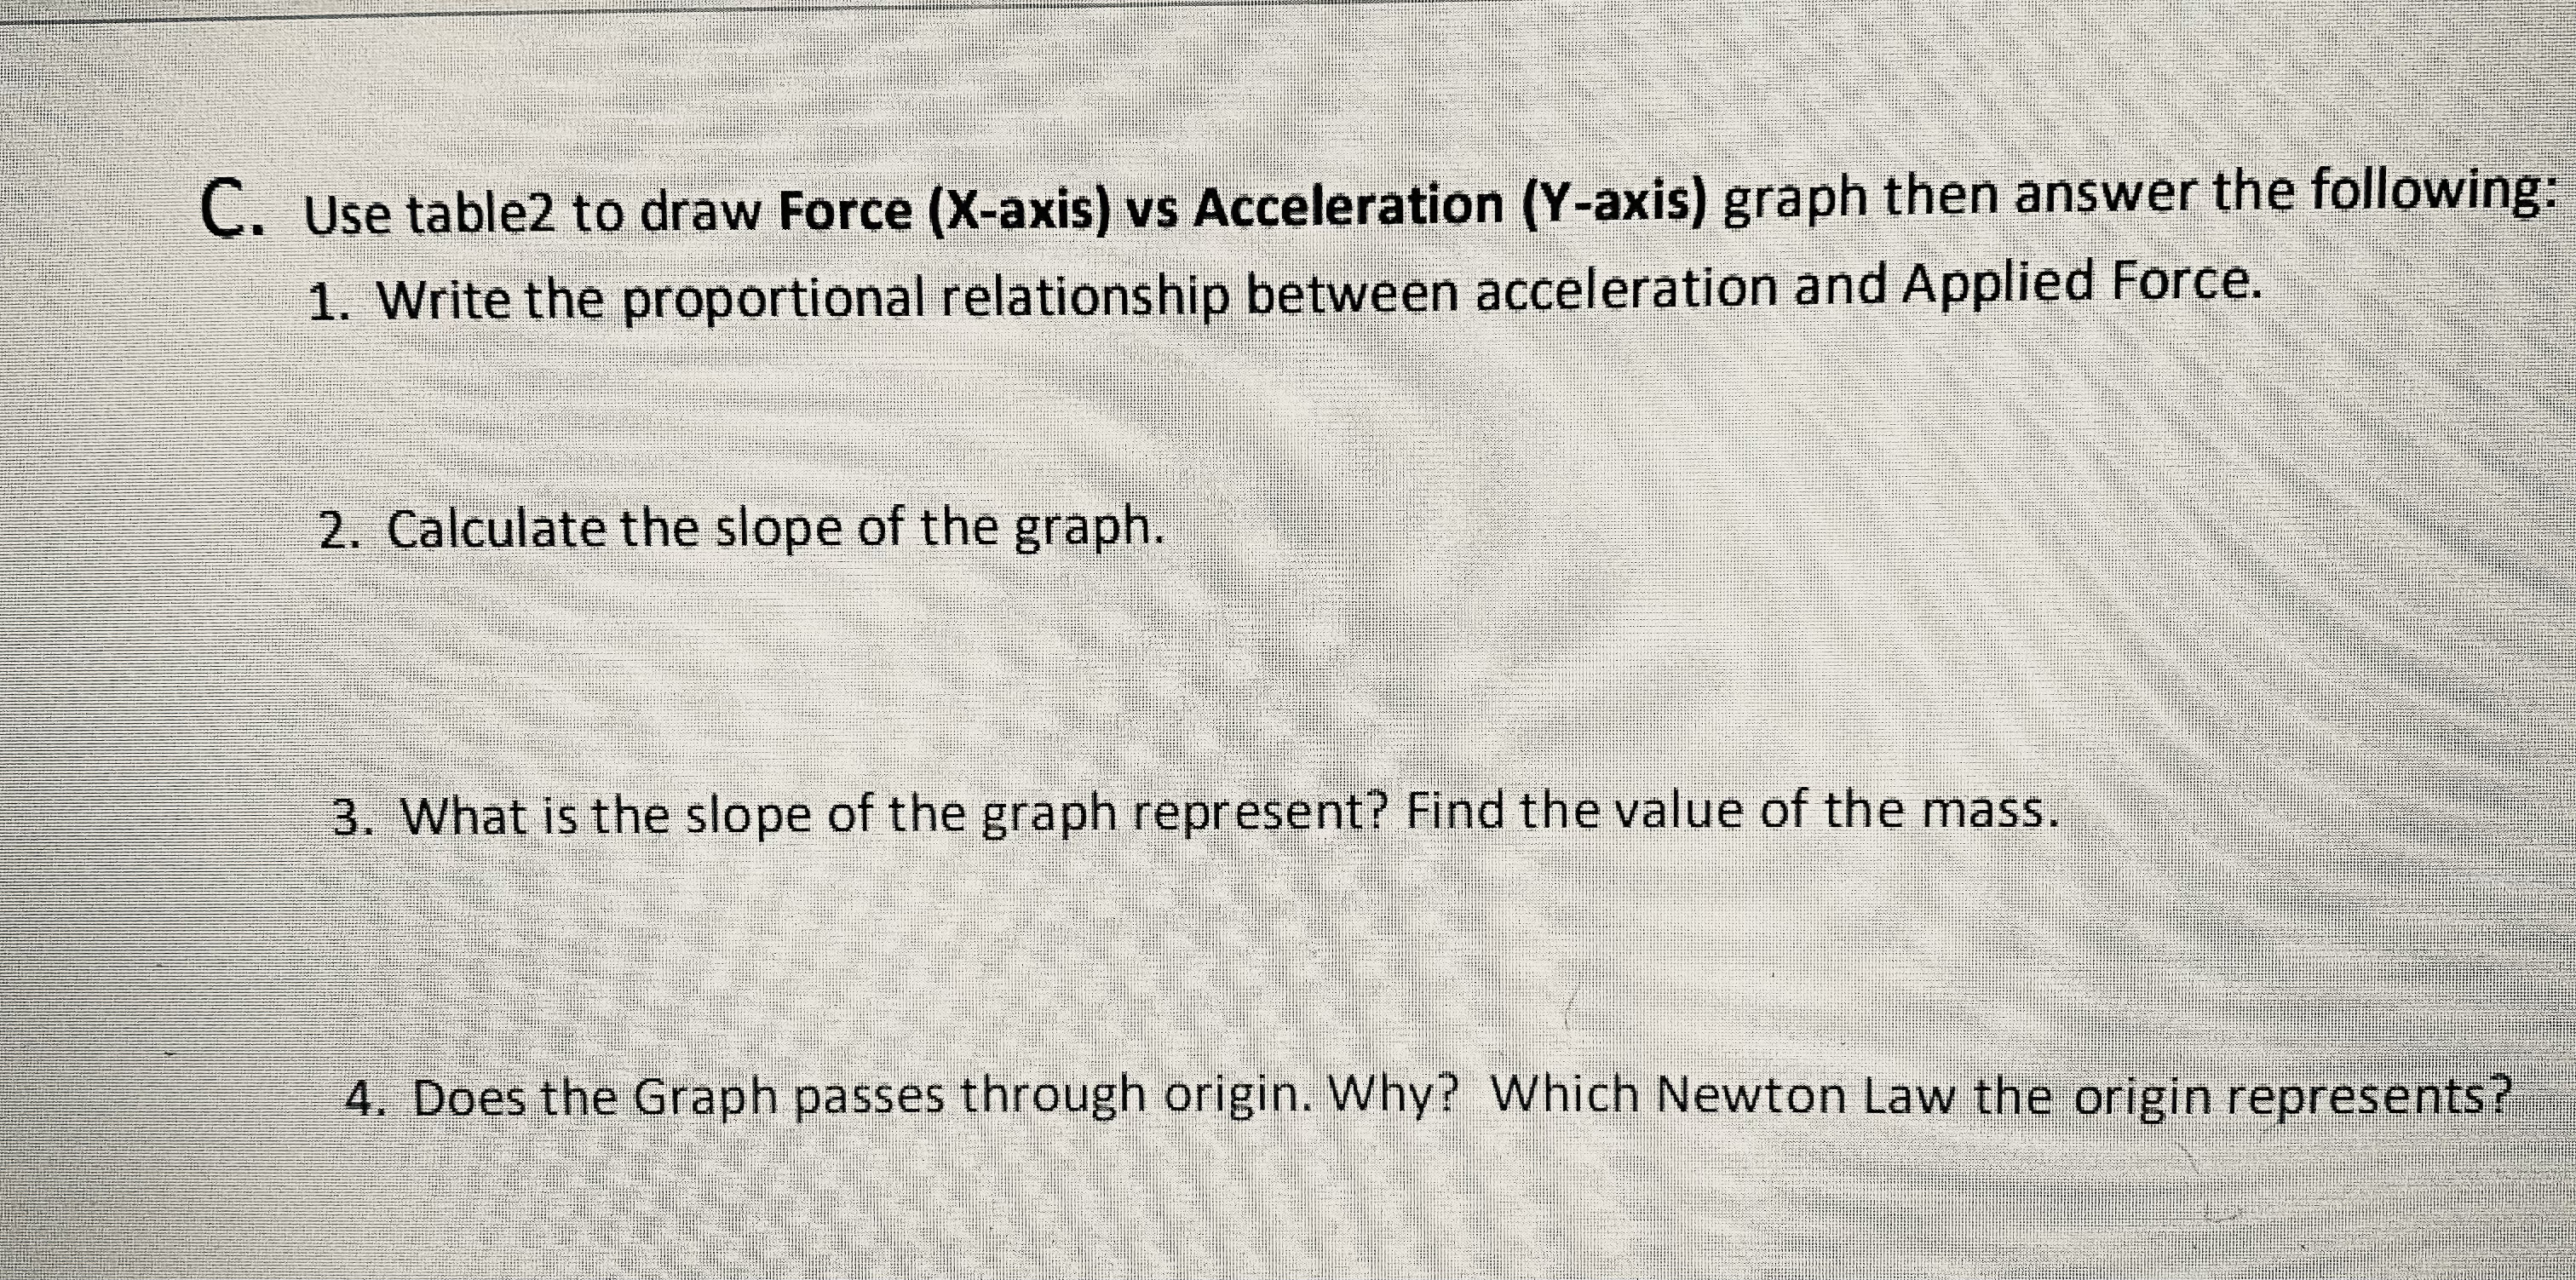
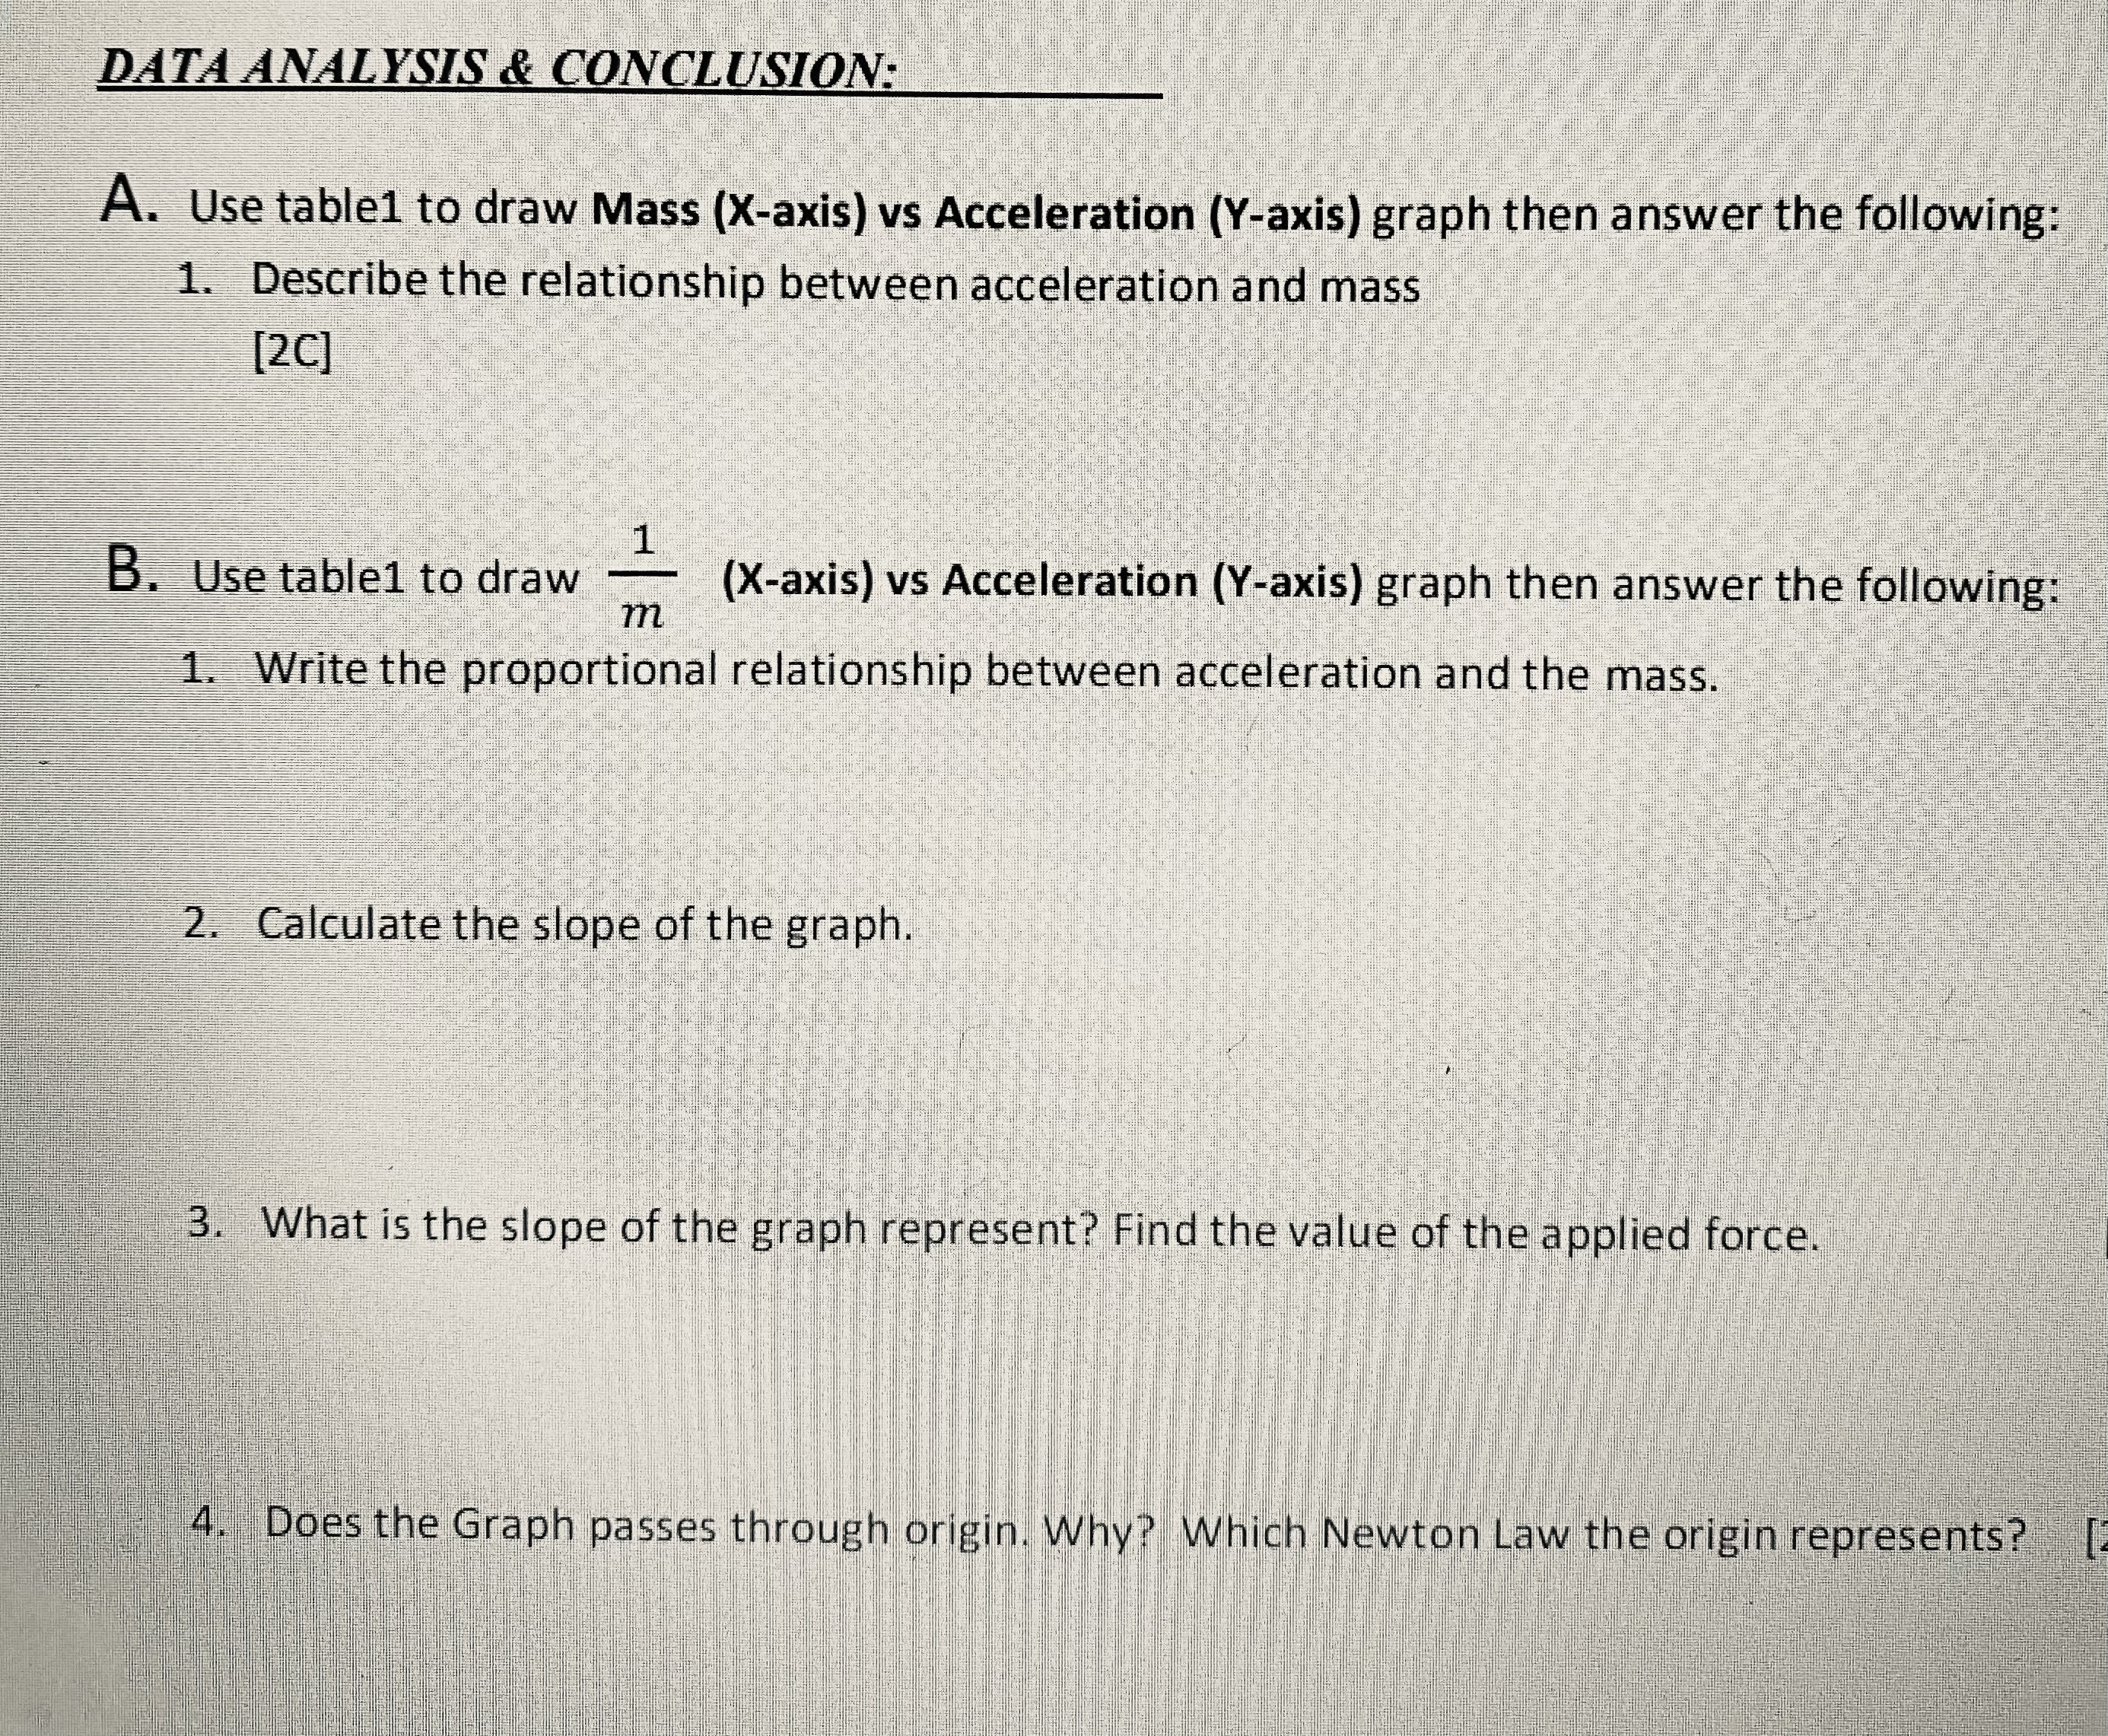
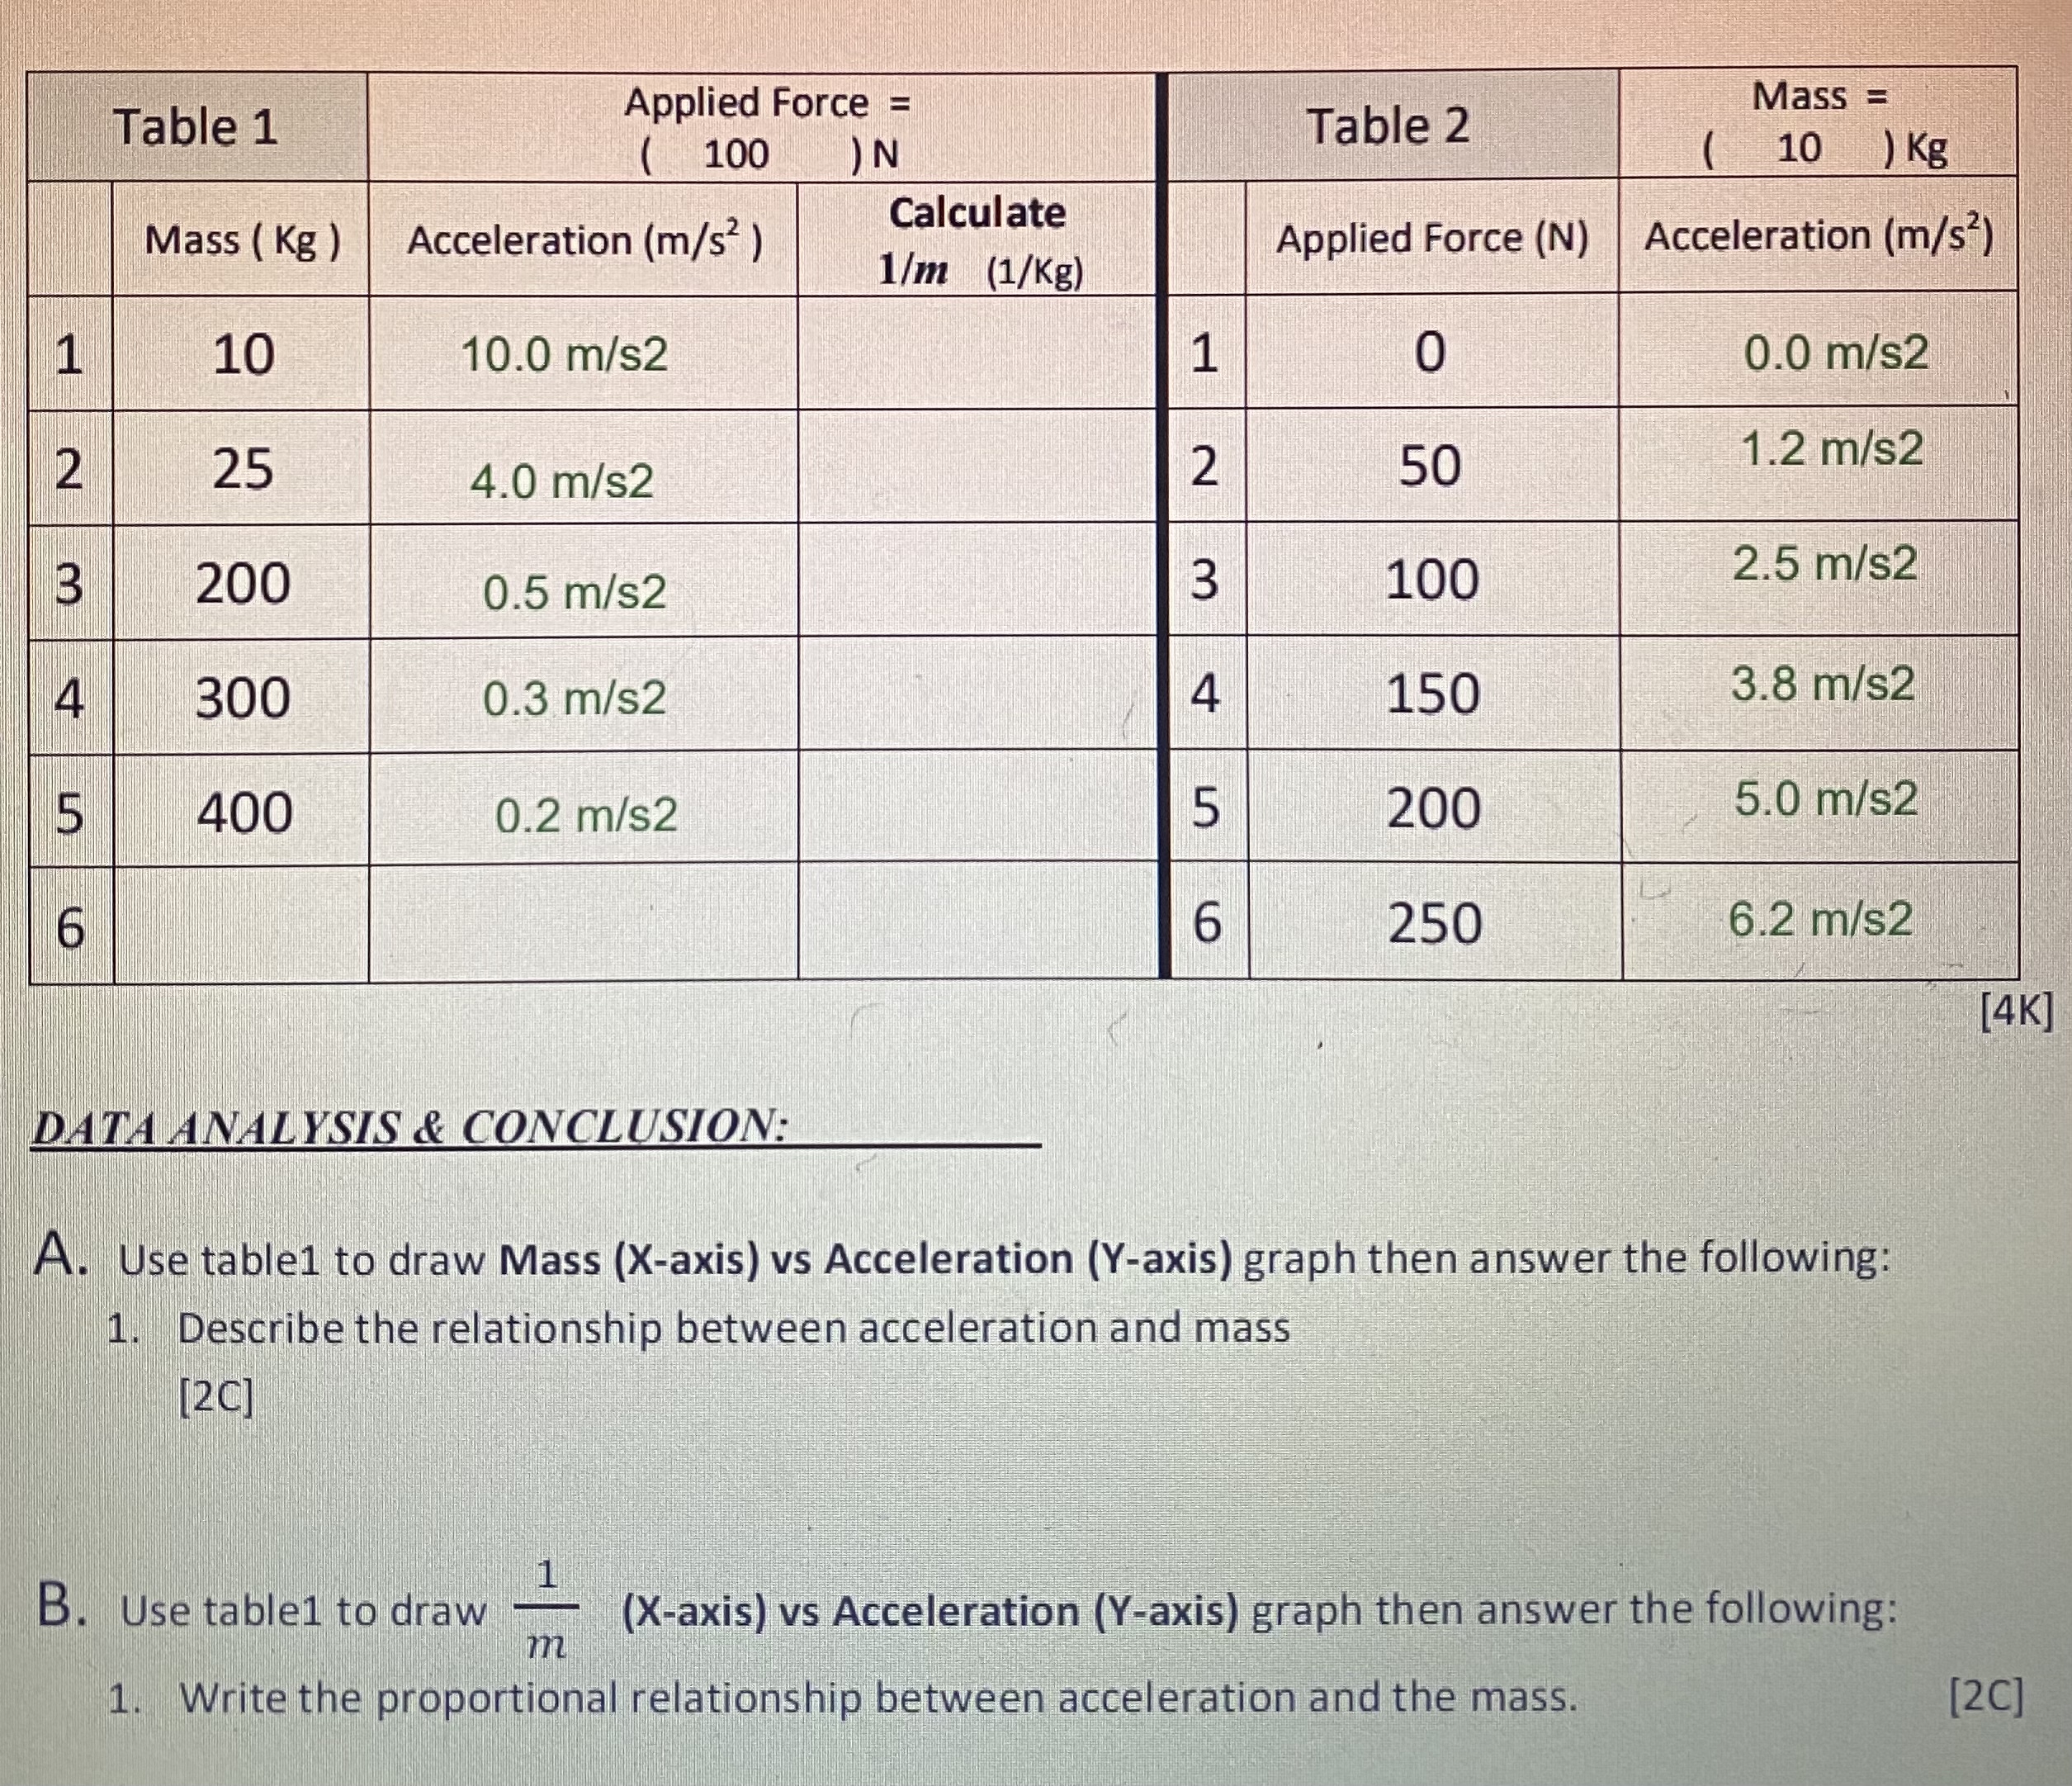
\fC. Use table2 to draw Force (X-axis) vs Acceleration (Y-axis) graph then answer the following: 1. Write the proportional relationship between acceleration and Applied Force. 2. Calculate the slope of the graph. 3. What is the slope of the graph represent? Find the value of the mass. 4. Does the Graph passes through origin. Why? Which Newton Law the origin represents?\fTable 1 Applied Force = Mass = ( 100 Table 2 10 ) Kg Mass ( Kg ) Acceleration (m/s? ) Calculate Applied Force (N) 1/m (1/Kg) Acceleration (m/s?) 10 10.0 m/s2 1 0 0.0 m/s2 2 25 4.0 m/s2 2 50 1.2 m/s2 200 0.5 m/s2 3 100 2.5 m/s2 4 300 0.3 m/s2 4 150 3.8 m/s2 400 0.2 m/s2 5 200 5.0 m/s2 6 6 250 6.2 m/s2 [4K] DATA ANALYSIS & CONCLUSION: A. Use table1 to draw Mass (X-axis) vs Acceleration (Y-axis) graph then answer the following: Describe the relationship between acceleration and mass [20] B. Use table1 to draw (X-axis) vs Acceleration (Y-axis) graph then answer the following: m 1. Write the proportional relationship between acceleration and the mass. [20]
Step by Step Solution
There are 3 Steps involved in it

Get step-by-step solutions from verified subject matter experts