

Question: fData: Let us suppose the following data was obtained during the investigation in the study of accelerated motion: | Tme | 00 |00 020|030 040050
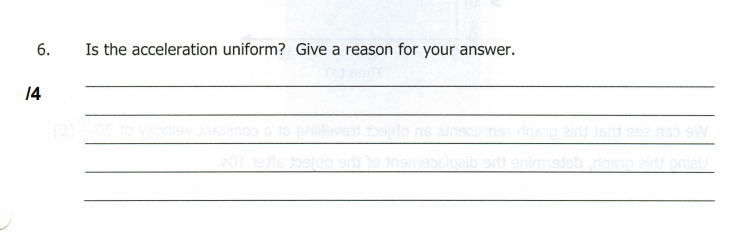

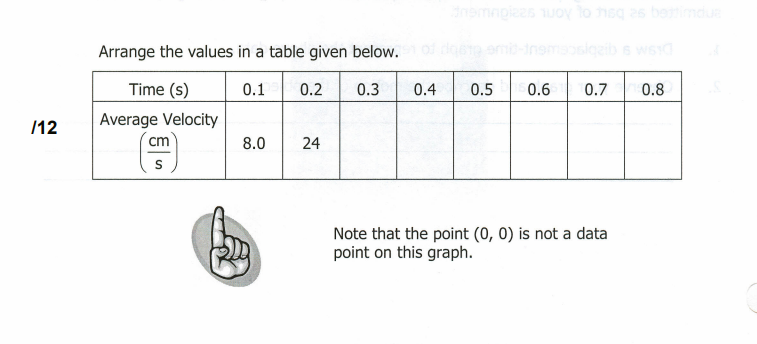
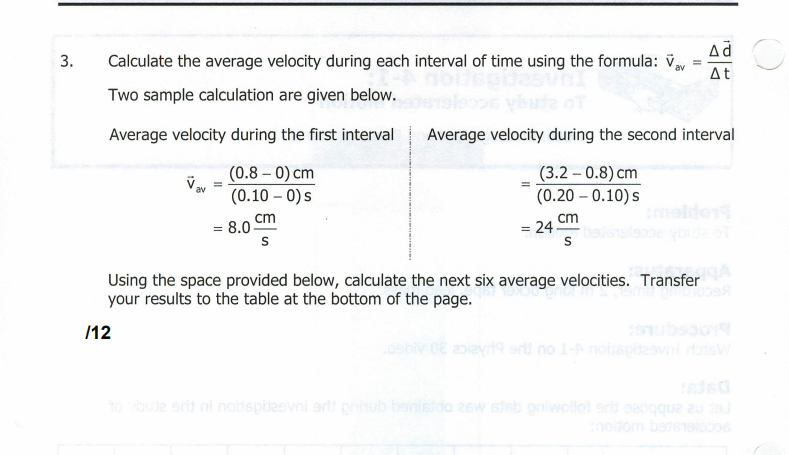


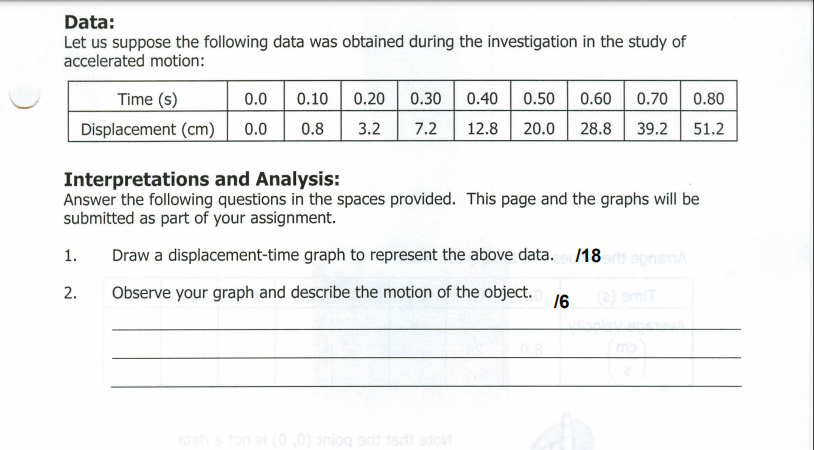


\fData: Let us suppose the following data was obtained during the investigation in the study of accelerated motion: | Tme | 00 |00 020|030 040050 060|070 |0s0 | Oisplacement (cm) | 00 [ 08 | 32 | 72 [ 128 | 200 [ 288 | 302 | 512 Interpretations and Analysis: Answer the following questions in the spaces provided. This page and the graphs will be submitted as part of your assignment. T Draw a displacement-time graph to represent the above data. /18 2. Observe your graph and describe the motion of the object. /6 Arrange the values in a table given below. | Tme() |01 )02 030405060708 % o H.l.l.l. Note that the point (0, 0) is not a data point on this graph. 3 Calculate the average velocity during each interval of time using the formula: v,, = a0 Two sample calculation are given below. & Average velocity during the first interval Average velocity during the second interval - _(0.8-0)cm _(3.2-0.8)cm (0.10-0)s (0.20 - 0.10)s = 80 =g = 5 i s Using the space provided below, calculate the next six average velocities. Transfer your results to the table at the bottom of the page. 12 4. Using the table of values you have just prepared, draw a Velocity-Time graph. 18 5. Calculate the slope of the graph in order to find the acceleration. Show your calculations in the space provided. 18
Step by Step Solution
There are 3 Steps involved in it

Get step-by-step solutions from verified subject matter experts