

Question: fDescribe the shaded region using n, U,' , -: TO a) B c) B e)||Y.|||||||I||||I|||||I|||||||I||||||I||||I'|||||I One hundred students were surveyed and asked if they are
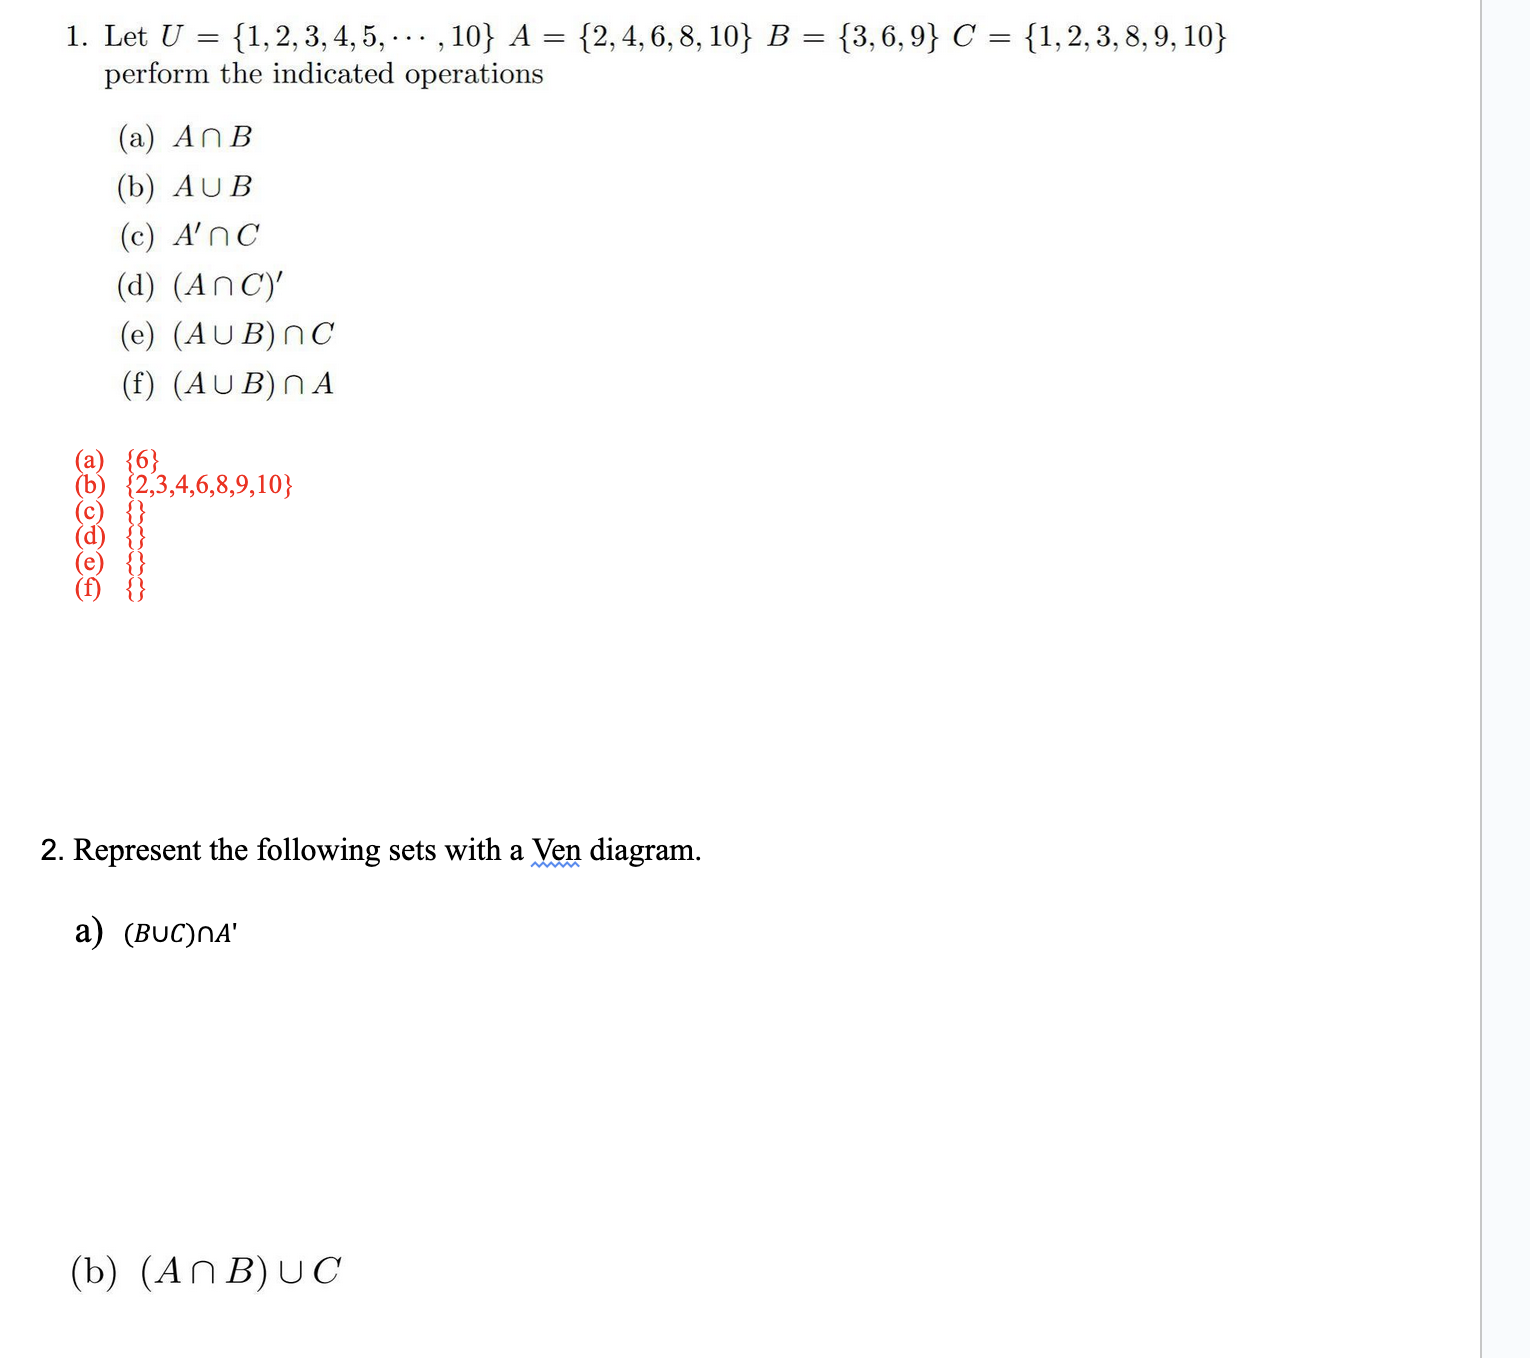
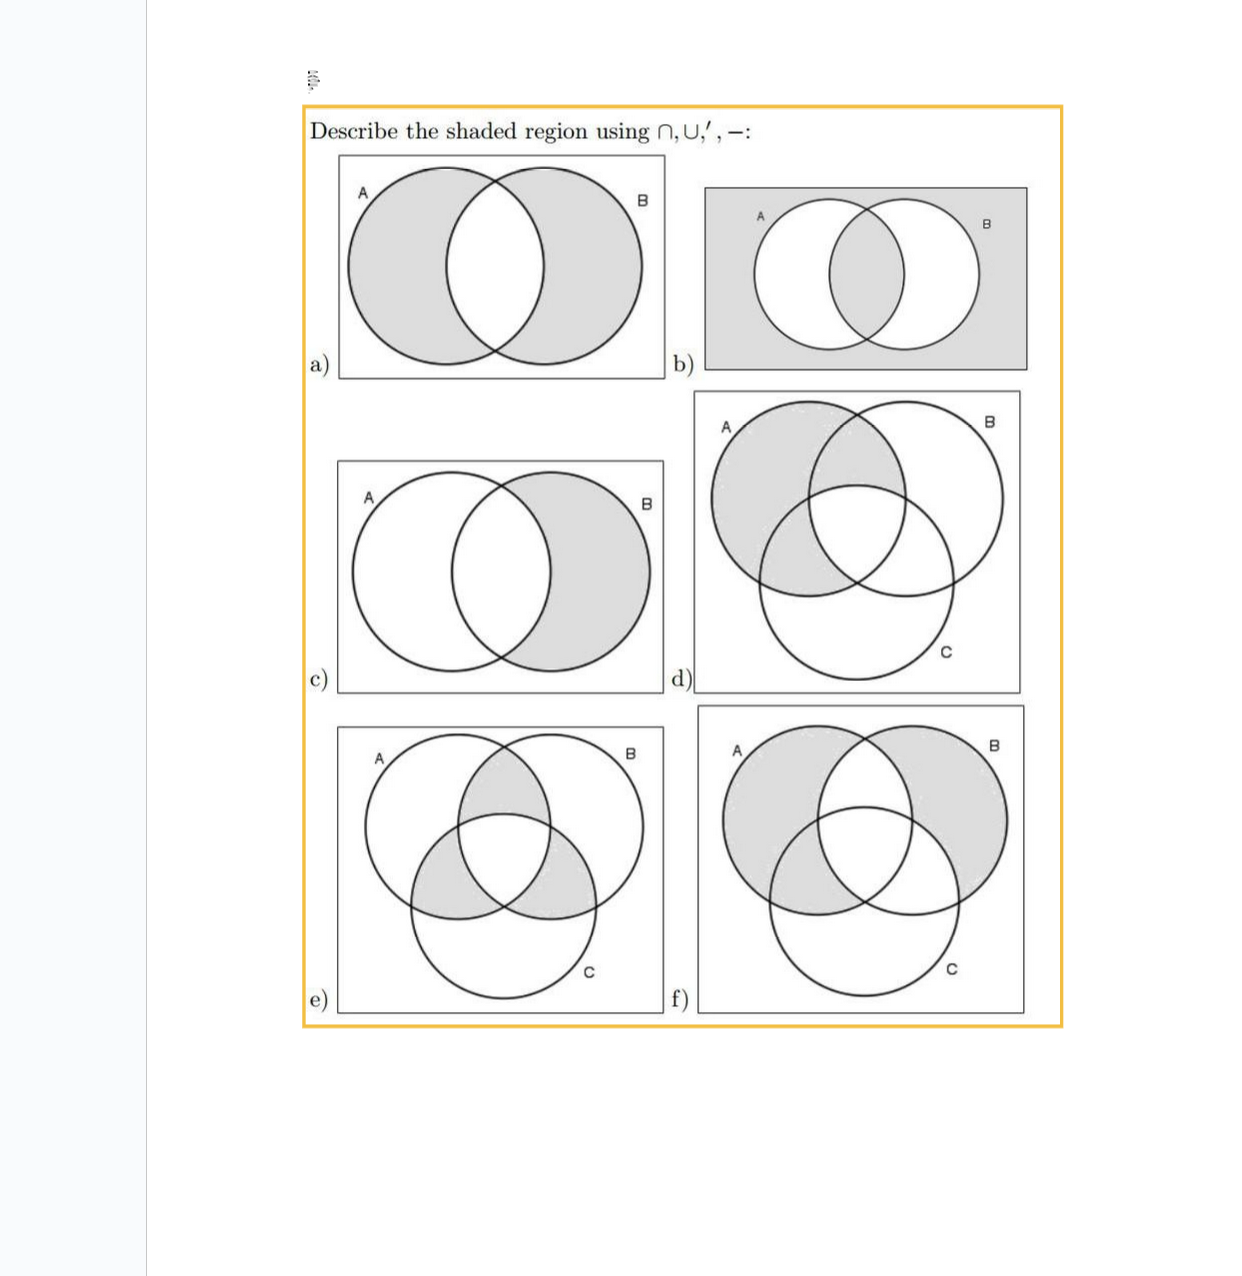
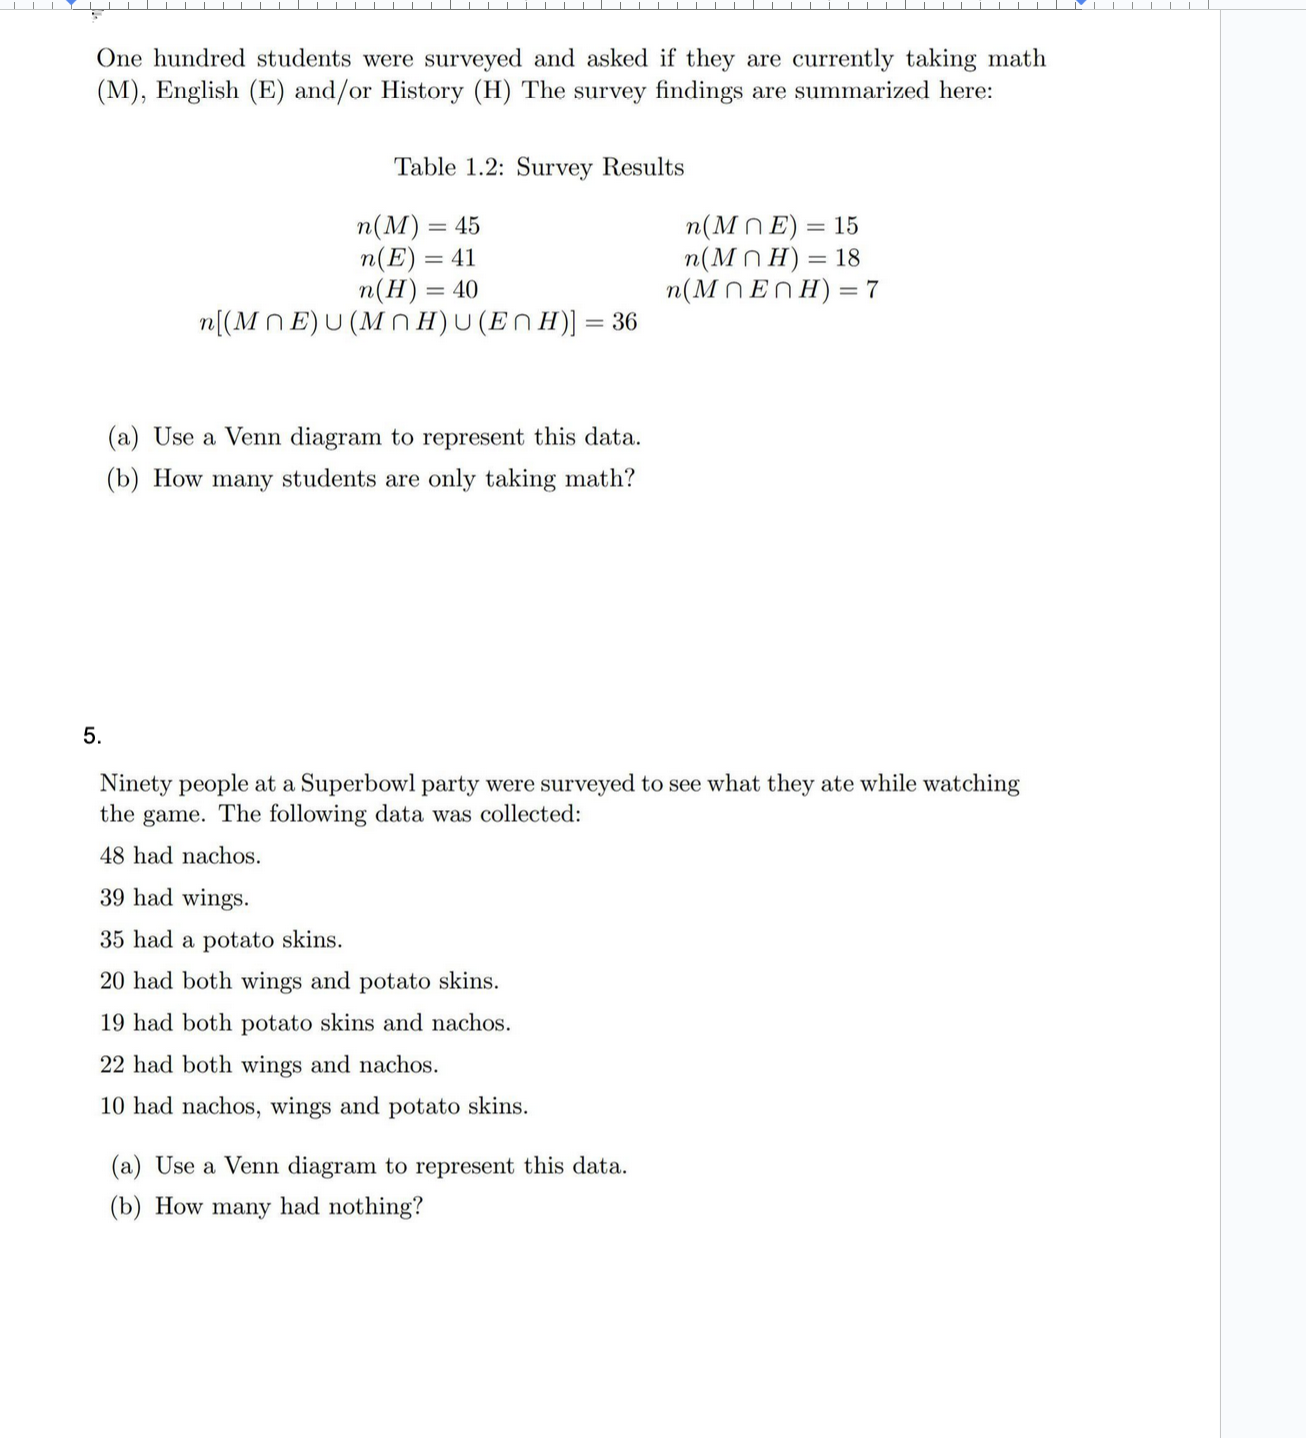
\fDescribe the shaded region using n, U,' , -: TO a) B c) B e)|\\|Y\\.||\\||\\||\\|I\\||\\||\\I|\\||\\||I|||||||I||||||\\I|\\\\||\\|I\\'||\\|||I One hundred students were surveyed and asked if they are currently taking math (M), English (E) and/or History (H) The survey findings are summarized here: Table 1.2: Survey Results n(M) = 45 n(MNE) =15 n(E) = 41 n(MNH)=18 n(H) = 40 n(MNENH)=17 n[(MNE)UMNH)U(ENH) =36 (a) Use a Venn diagram to represent this data. (b) How many students are only taking math? 5. Ninety people at a Superbowl party were surveyed to see what they ate while watching the game. The following data was collected: 48 had nachos. 39 had wings. 35 had a potato skins. 20 had both wings and potato skins. 19 had both potato skins and nachos. 22 had both wings and nachos. 10 had nachos, wings and potato skins. (a) Use a Venn diagram to represent this data. (b) How many had nothing
Step by Step Solution
There are 3 Steps involved in it

Get step-by-step solutions from verified subject matter experts