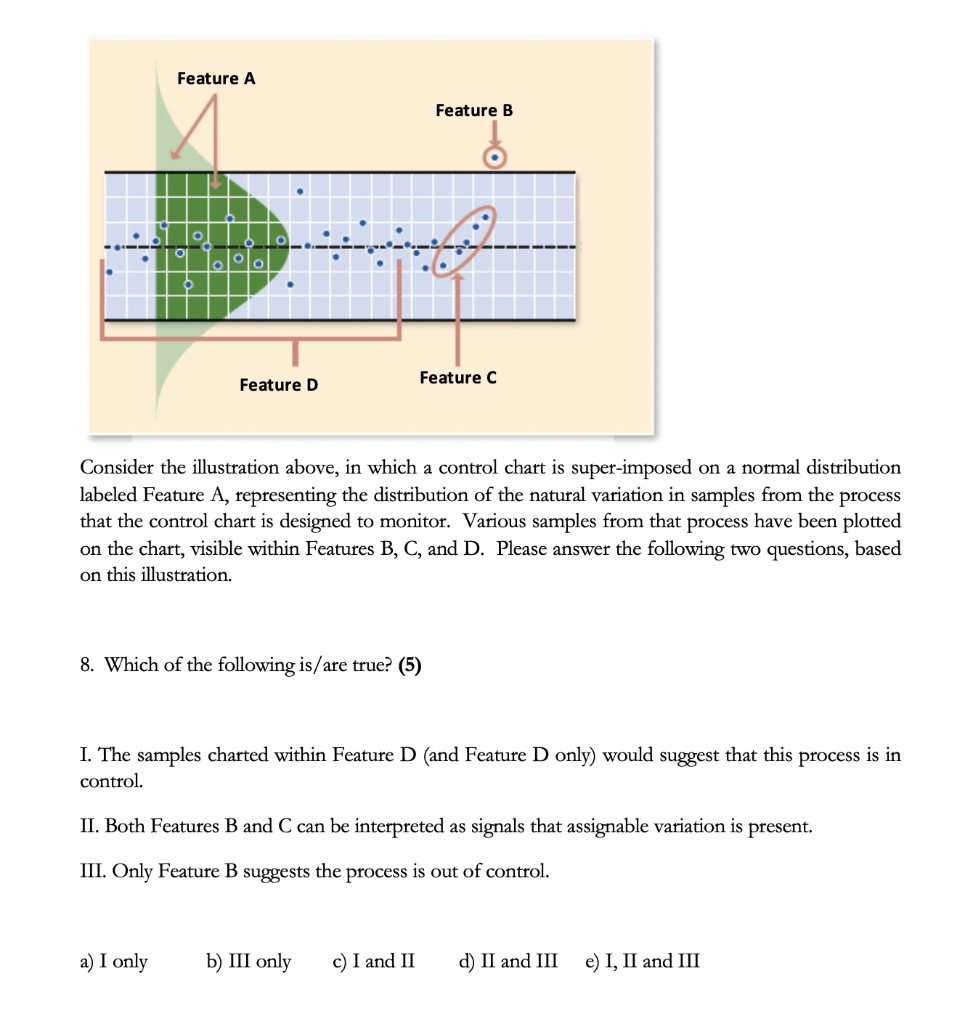
Question: Feature A Feature B Feature D Feature C Consider the illustration above, in which a control chart is super-imposed on a normal distribution labeled Feature

Feature A Feature B Feature D Feature C Consider

Feature A Feature B Feature D Feature C Consider the illustration above, in which a control chart is super-imposed on a normal distribution labeled Feature A, representing the distribution of the natural variation in samples from the process that the control chart is designed to monitor. Various samples from that process have been plotted on the chart, visible within Features B, C, and D. Please answer the following two questions, based on this illustration. 8. Which of the following is/are true? (5) I. The samples charted within Feature D (and Feature D only) would suggest that this process is in control. II. Both Features B and C can be interpreted as signals that assignable variation is present. III. Only Feature B suggests the process is out of control. a) I only b) III only c) I and II d) II and III e) I, II and

Step by Step Solution

There are 3 Steps involved in it

1 Expert Approved Answer
Step: 1 Unlock blur-text-image
Question Has Been Solved by an Expert!

Get step-by-step solutions from verified subject matter experts

Step: 2 Unlock
Step: 3 Unlock

Students Have Also Explored These Related General Management Questions!