

Question: felse if age 65, then Senior). b. Create a new attribute Relatives. To create this column, the total number of relatives that include siblings, spouse,
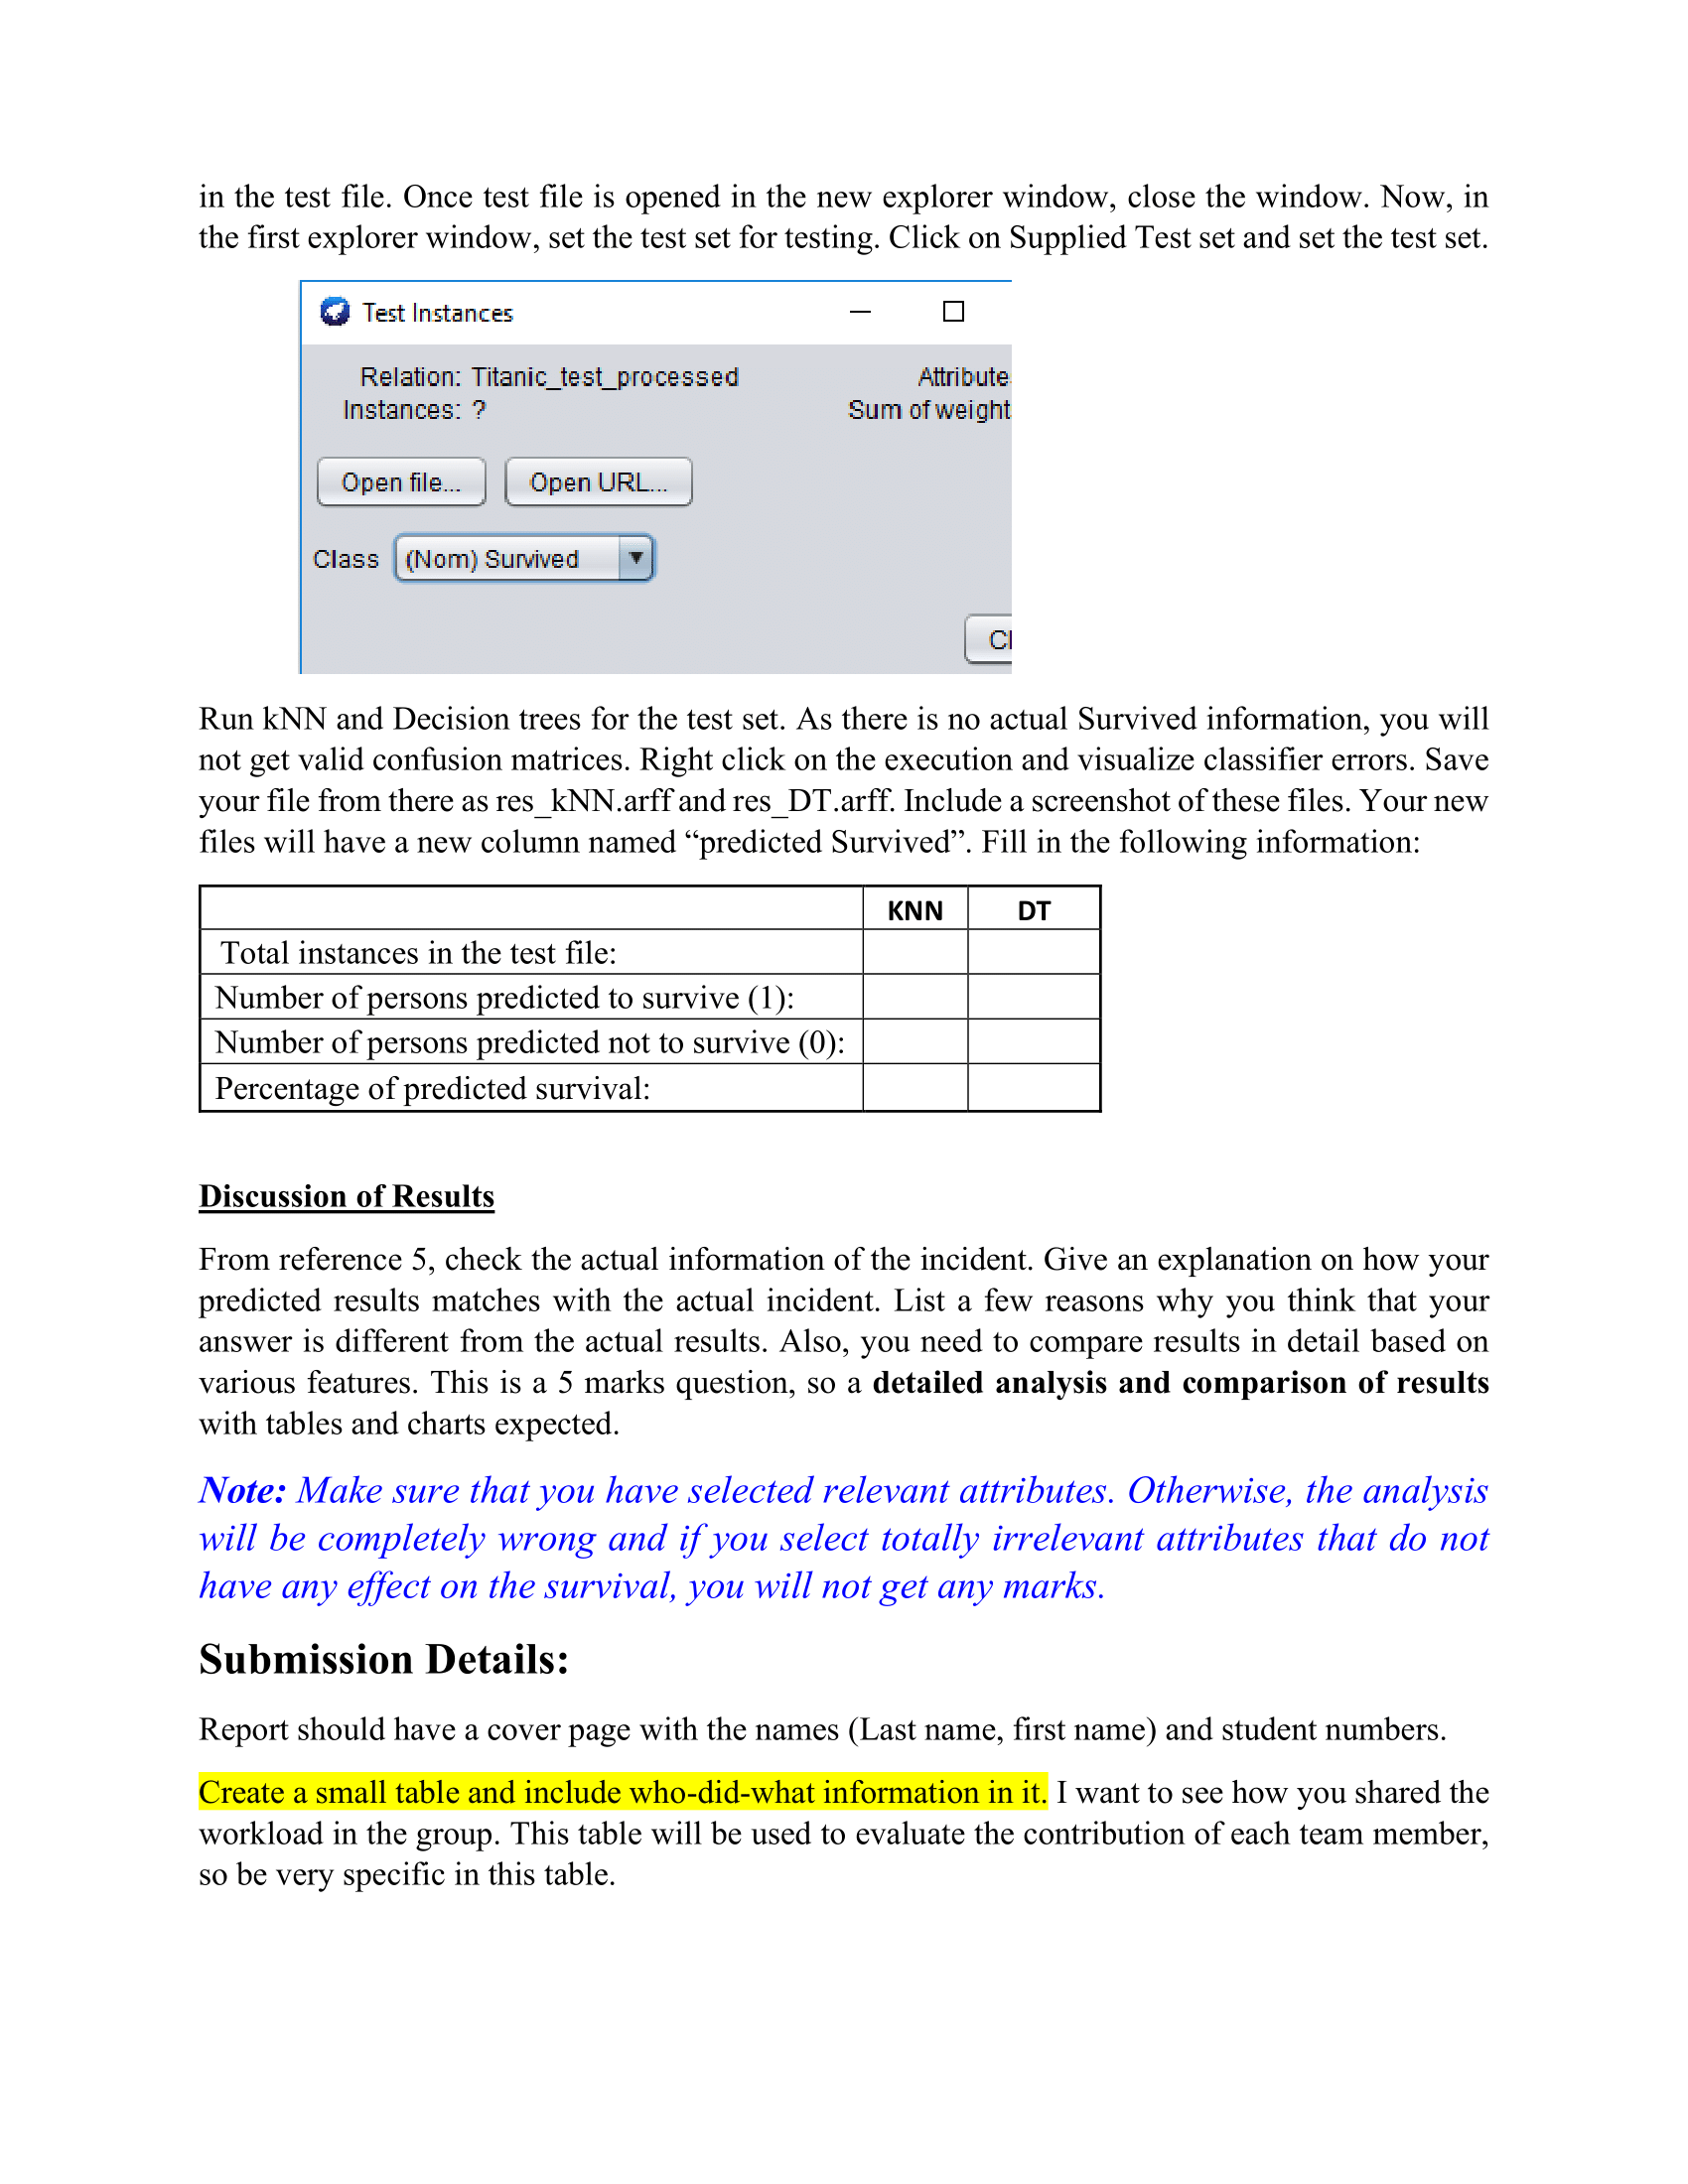
\felse if age 65, then Senior). b. Create a new attribute \"Relatives". To create this column, the total number of relatives that include siblings, spouse, parents and children should be calculated. if the number of relatives is 0, record it as \"None\in the test le. Once test le is opened in the new explorer window, close the window. Now, in the rst explorer window, set the test set for testing. Click on Supplied Test set and set the test set. 9 Test Instances El Relation: Titanic_te st_pro cessed Attribute Instances: ?' Sum ofweignt Upenle... IUpenURL... Class New} Survived 1' CI Run kNN and Decision trees for the test set. As there is no actual Survived information, you will not get valid confusion matrices. Right click on the execution and visualize classier errors. Save your le from there as resikNNarff and resiDTarff. Include a screenshot of these les. Your new les will have a new column named \"predicted Survived\". Fill in the following information: Total instances in the test le: Number of persons predicted to survive (1): Number of persons predicted not to survive (0): Percentage of predicted survival: Discussion of Results From reference 5, check the actual information of the incident. Give an explanation on how your predicted results matches with the actual incident. List a few reasons why you think that your answer is different from the actual results. Also, you need to compare results in detail based on various features. This is a 5 marks question, so a detailed analysis and comparison of results with tables and charts expected. Note: Make sure that you have selected relevant attributes. Otherwise, the analysis will be completely wrong and ifyou select totally irrelevant attributes that do not have any effect on the survival, you will not get any marks. Submission Details: Report should have a cover page with the names (Last name, rst name) and student numbers. Create a small table and include who-didwhat information in it. I want to see how you shared the workload in the group. This table will be used to evaluate the contribution of each team member, so be very specic in this table. You must paste all screenshots in the report. The report should have table of contents, images, etc., sections titled Introduction, Business Understanding, Data Understanding, Data Preparation, Modeling and Evaluation, Discussion of Results, Conclusion, References etc. Font: Times New Roman. Font size: 12, justied Now, create a zipped folder named:
Step by Step Solution
There are 3 Steps involved in it

Get step-by-step solutions from verified subject matter experts