

Question: of II BLISS IOI Business Statistics - X C G) File Type here to search Page view Read aloud Draw Highlight Question 4 (10
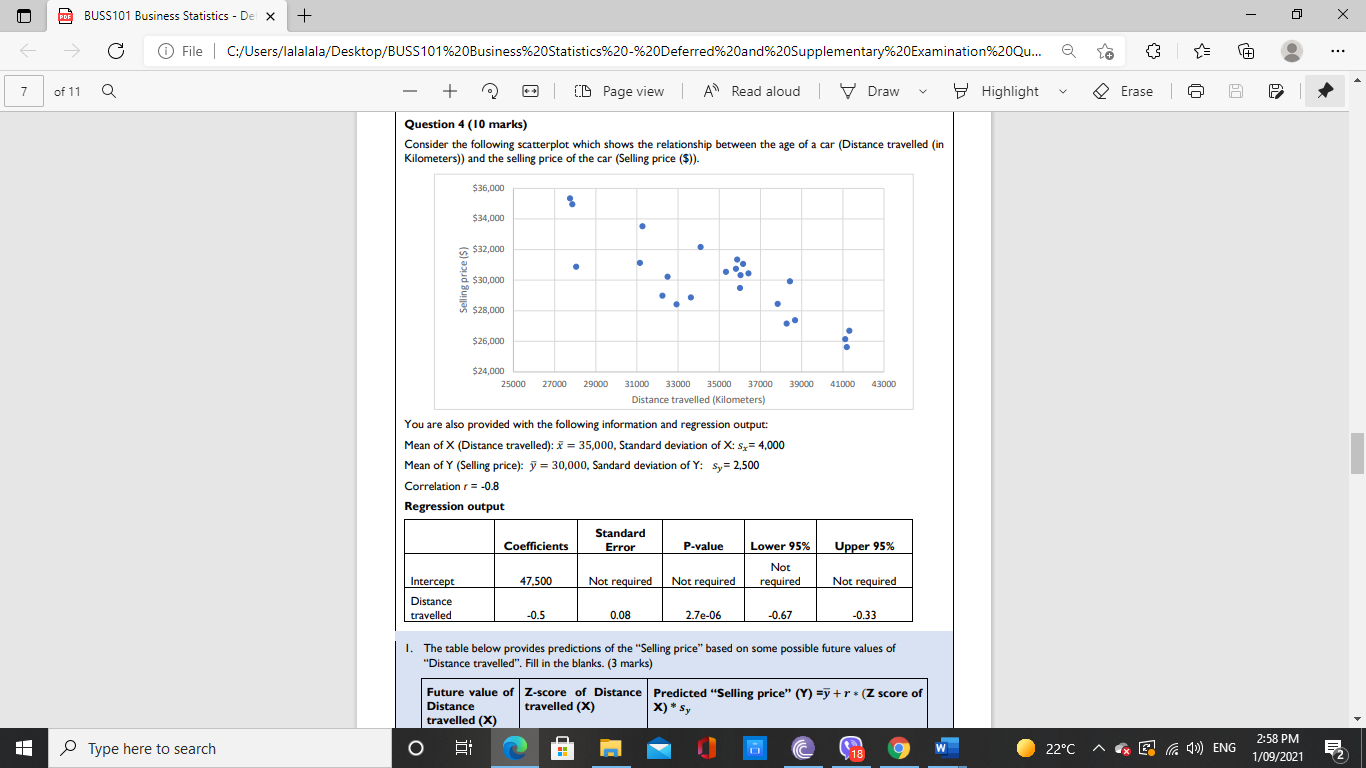
of II BLISS IOI Business Statistics - X C G) File Type here to search Page view Read aloud Draw Highlight Question 4 (10 marks) Consider the following scatterplot Which Shows the relationship age Of a (Distance travelled (in Kilometers)) and the selling price Of the Car (Selling 536.0M 334.0M 532.0M 530.0M S2E.Ocn 326.0M 324.0M 25000 27XO 310m 33cno 350M 37TO You are also With following information and regression output: Mean Of X (Distarxe travelled): 35,000, Standard deviation Of X: Meanofy (Sellingprice): 30,000, Sandard deviationofy: sy- 2500 Correlation r = Regression output ell ed Coefficients 47 500 -0.5 Not uired 008 P-value Not uired 2_7e-06 Lower 95% -0.67 430m N Ot u ired -033 I The table below provides predictions Of "Selling on Some possible future values Of "Distance travelled". Fill in the blanks. (3 marks) Future value of Z-score of Distance Predicted "Selling price" (Y) + r (Z score of travelled (X) travelled (X) 220C O Erase A @ (D) ENG 2:58 PM 1/09/2021
Step by Step Solution
There are 3 Steps involved in it

Get step-by-step solutions from verified subject matter experts