

Question: Bayesian Correlation Bayesian Correlation Table Pearson Kendall n 3F 10 Lower 95% Cl Upper 95% CI tau B BF 10 Lower 95% Cl Upper 95%


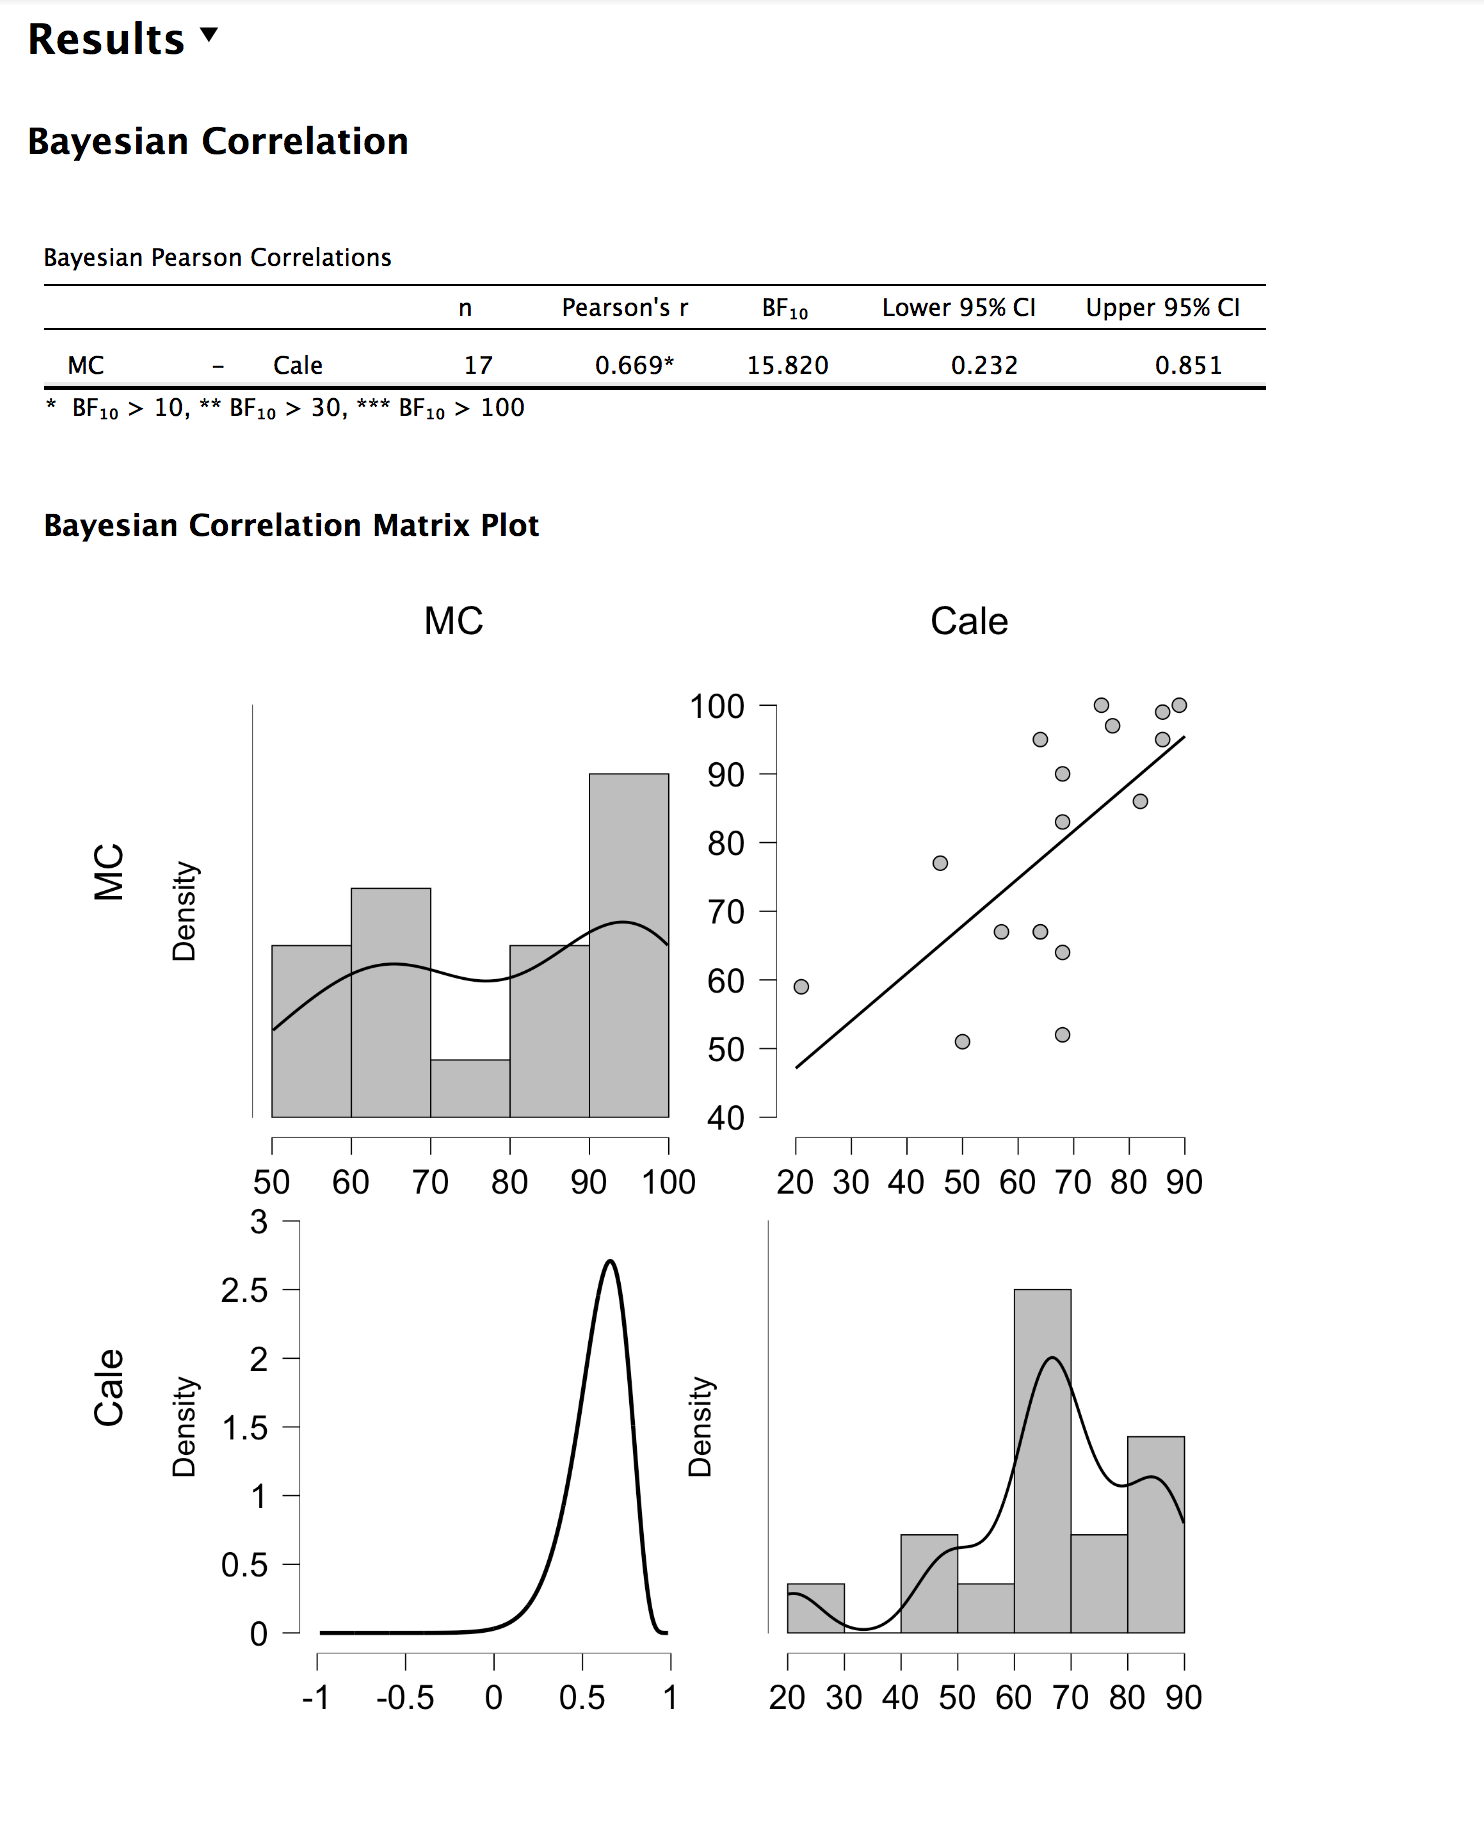
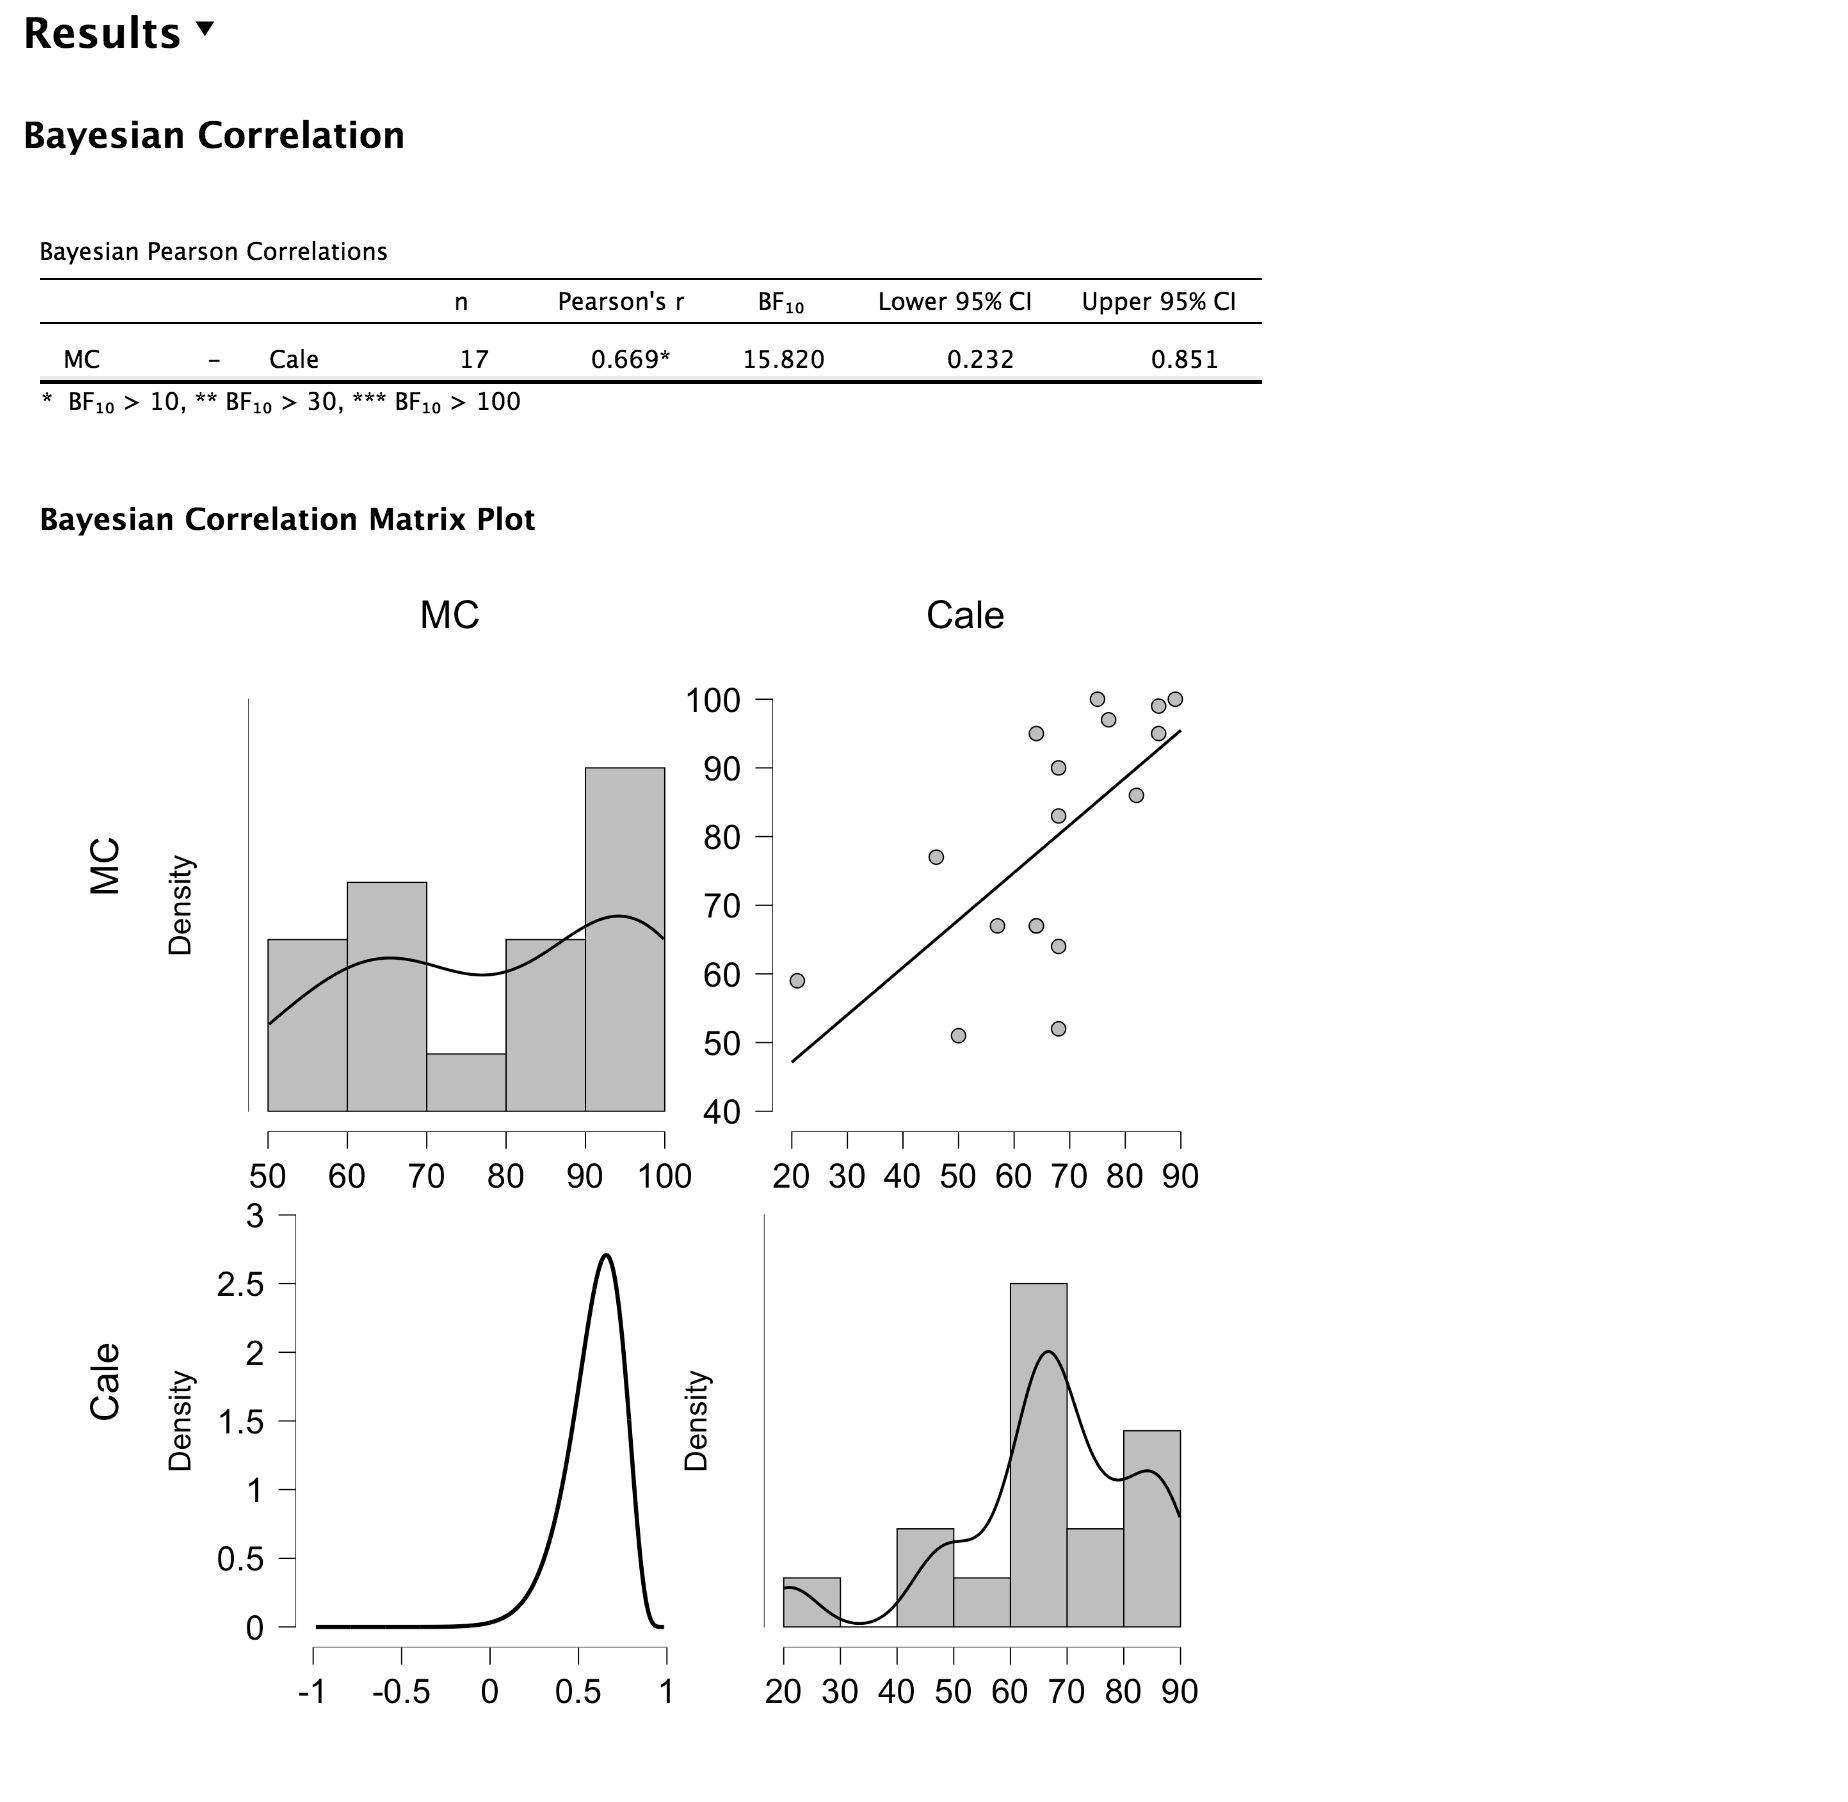
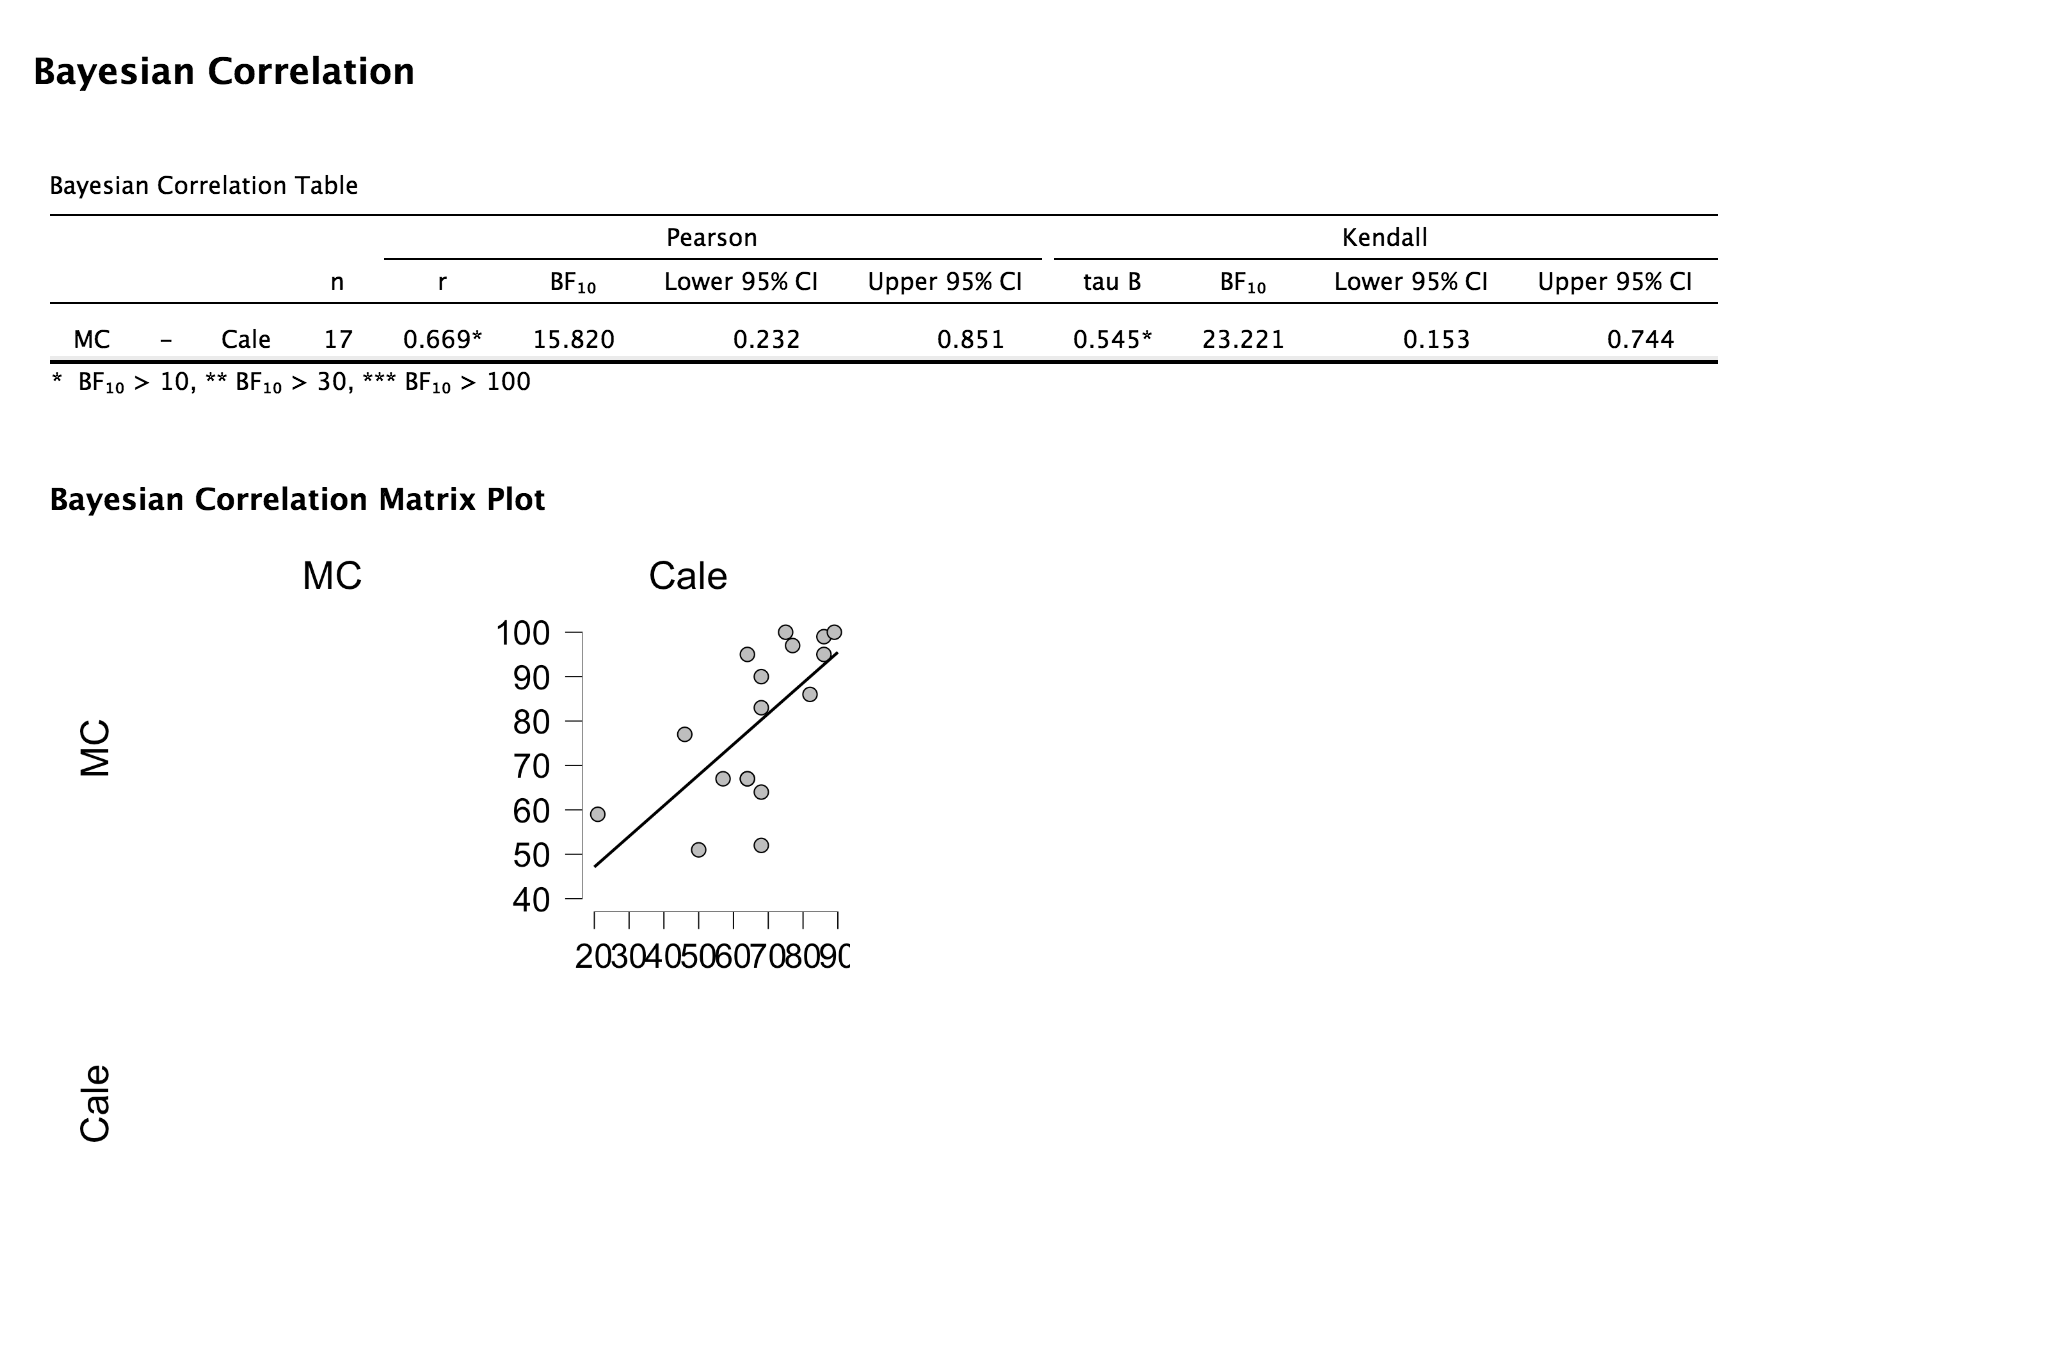
Bayesian Correlation Bayesian Correlation Table Pearson Kendall n 3F 10 Lower 95% Cl Upper 95% CI tau B BF 10 Lower 95% Cl Upper 95% CI MC Cale 17 0.669* 15.820 0.232 0.851 0.545* 23.221 0.153 0.744 * BF10 > 10, ** BF10 > 30, *** BF10 > 100 Bayesian Correlation Matrix Plot MC Cale 100 CO 90 oo O O 80 MC 70 60 C 50 O 40 20304050607 0809C Cale
Step by Step Solution
There are 3 Steps involved in it
1 Expert Approved Answer
Step: 1 Unlock

Question Has Been Solved by an Expert!
Get step-by-step solutions from verified subject matter experts
Step: 2 Unlock
Step: 3 Unlock