

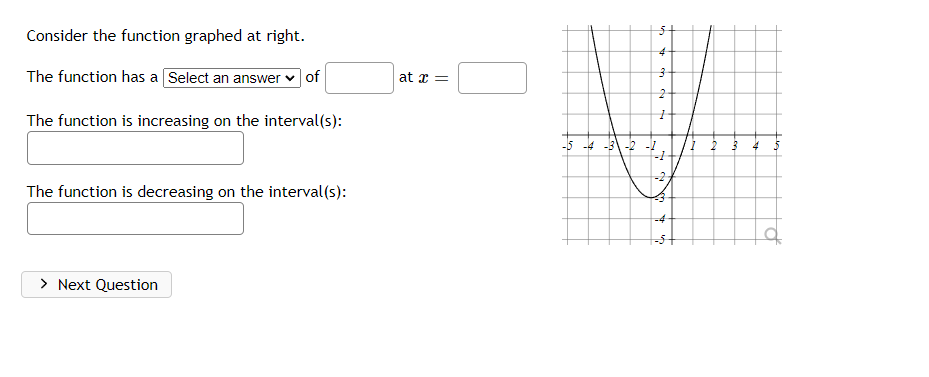
Question: Consider the function graphed at right. The function has a oil iat :1: = i The function is increasing on the intervailfs}: The function is


![is decreasing on the intervaus]: :J The domain of the function is:](https://s3.amazonaws.com/si.experts.images/answers/2024/06/667b6dc3efe32_059667b6dc3e0689.jpg)

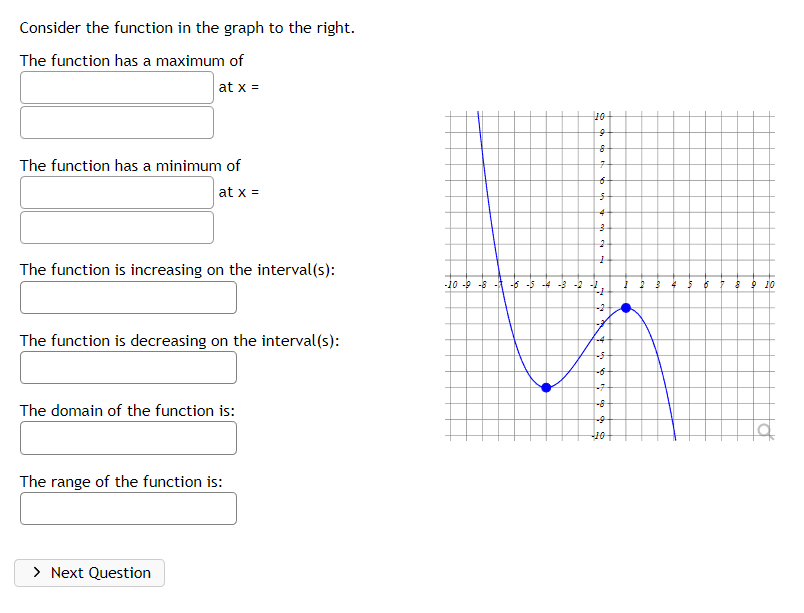
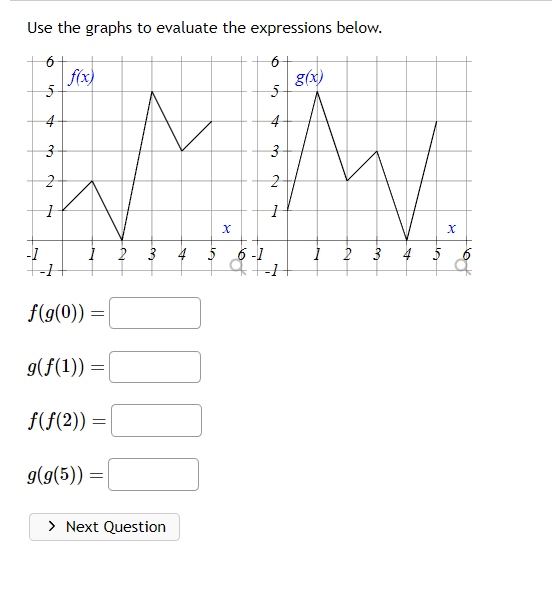
Consider the function graphed at right. The function has a oil iat :1: = i The function is increasing on the intervailfs}: The function is decreasing on the intervaLis): > Next Question Consider the function in the graph to the right. The function has a maximum of l latx= | | The function has a minimum of | latx= | | The function is increasing on the interval.{s}: :J The function is decreasing on the intervaus]: :J The domain of the function is: :J The range of the function is: J > Next Question Use the graphs to evaluate the expressions below. 6 6 fix g(X) 4 4 4 1 4 f(g(0)) = g(f(1)) f(f(2)) g(g(5)) = > Next
Step by Step Solution
There are 3 Steps involved in it
1 Expert Approved Answer
Step: 1 Unlock

Question Has Been Solved by an Expert!
Get step-by-step solutions from verified subject matter experts
Step: 2 Unlock
Step: 3 Unlock