

Question: fb) (10 points) Draw two diagrams vertically with the labor market on the bottom graph and the production motion on the top graph. Be sure
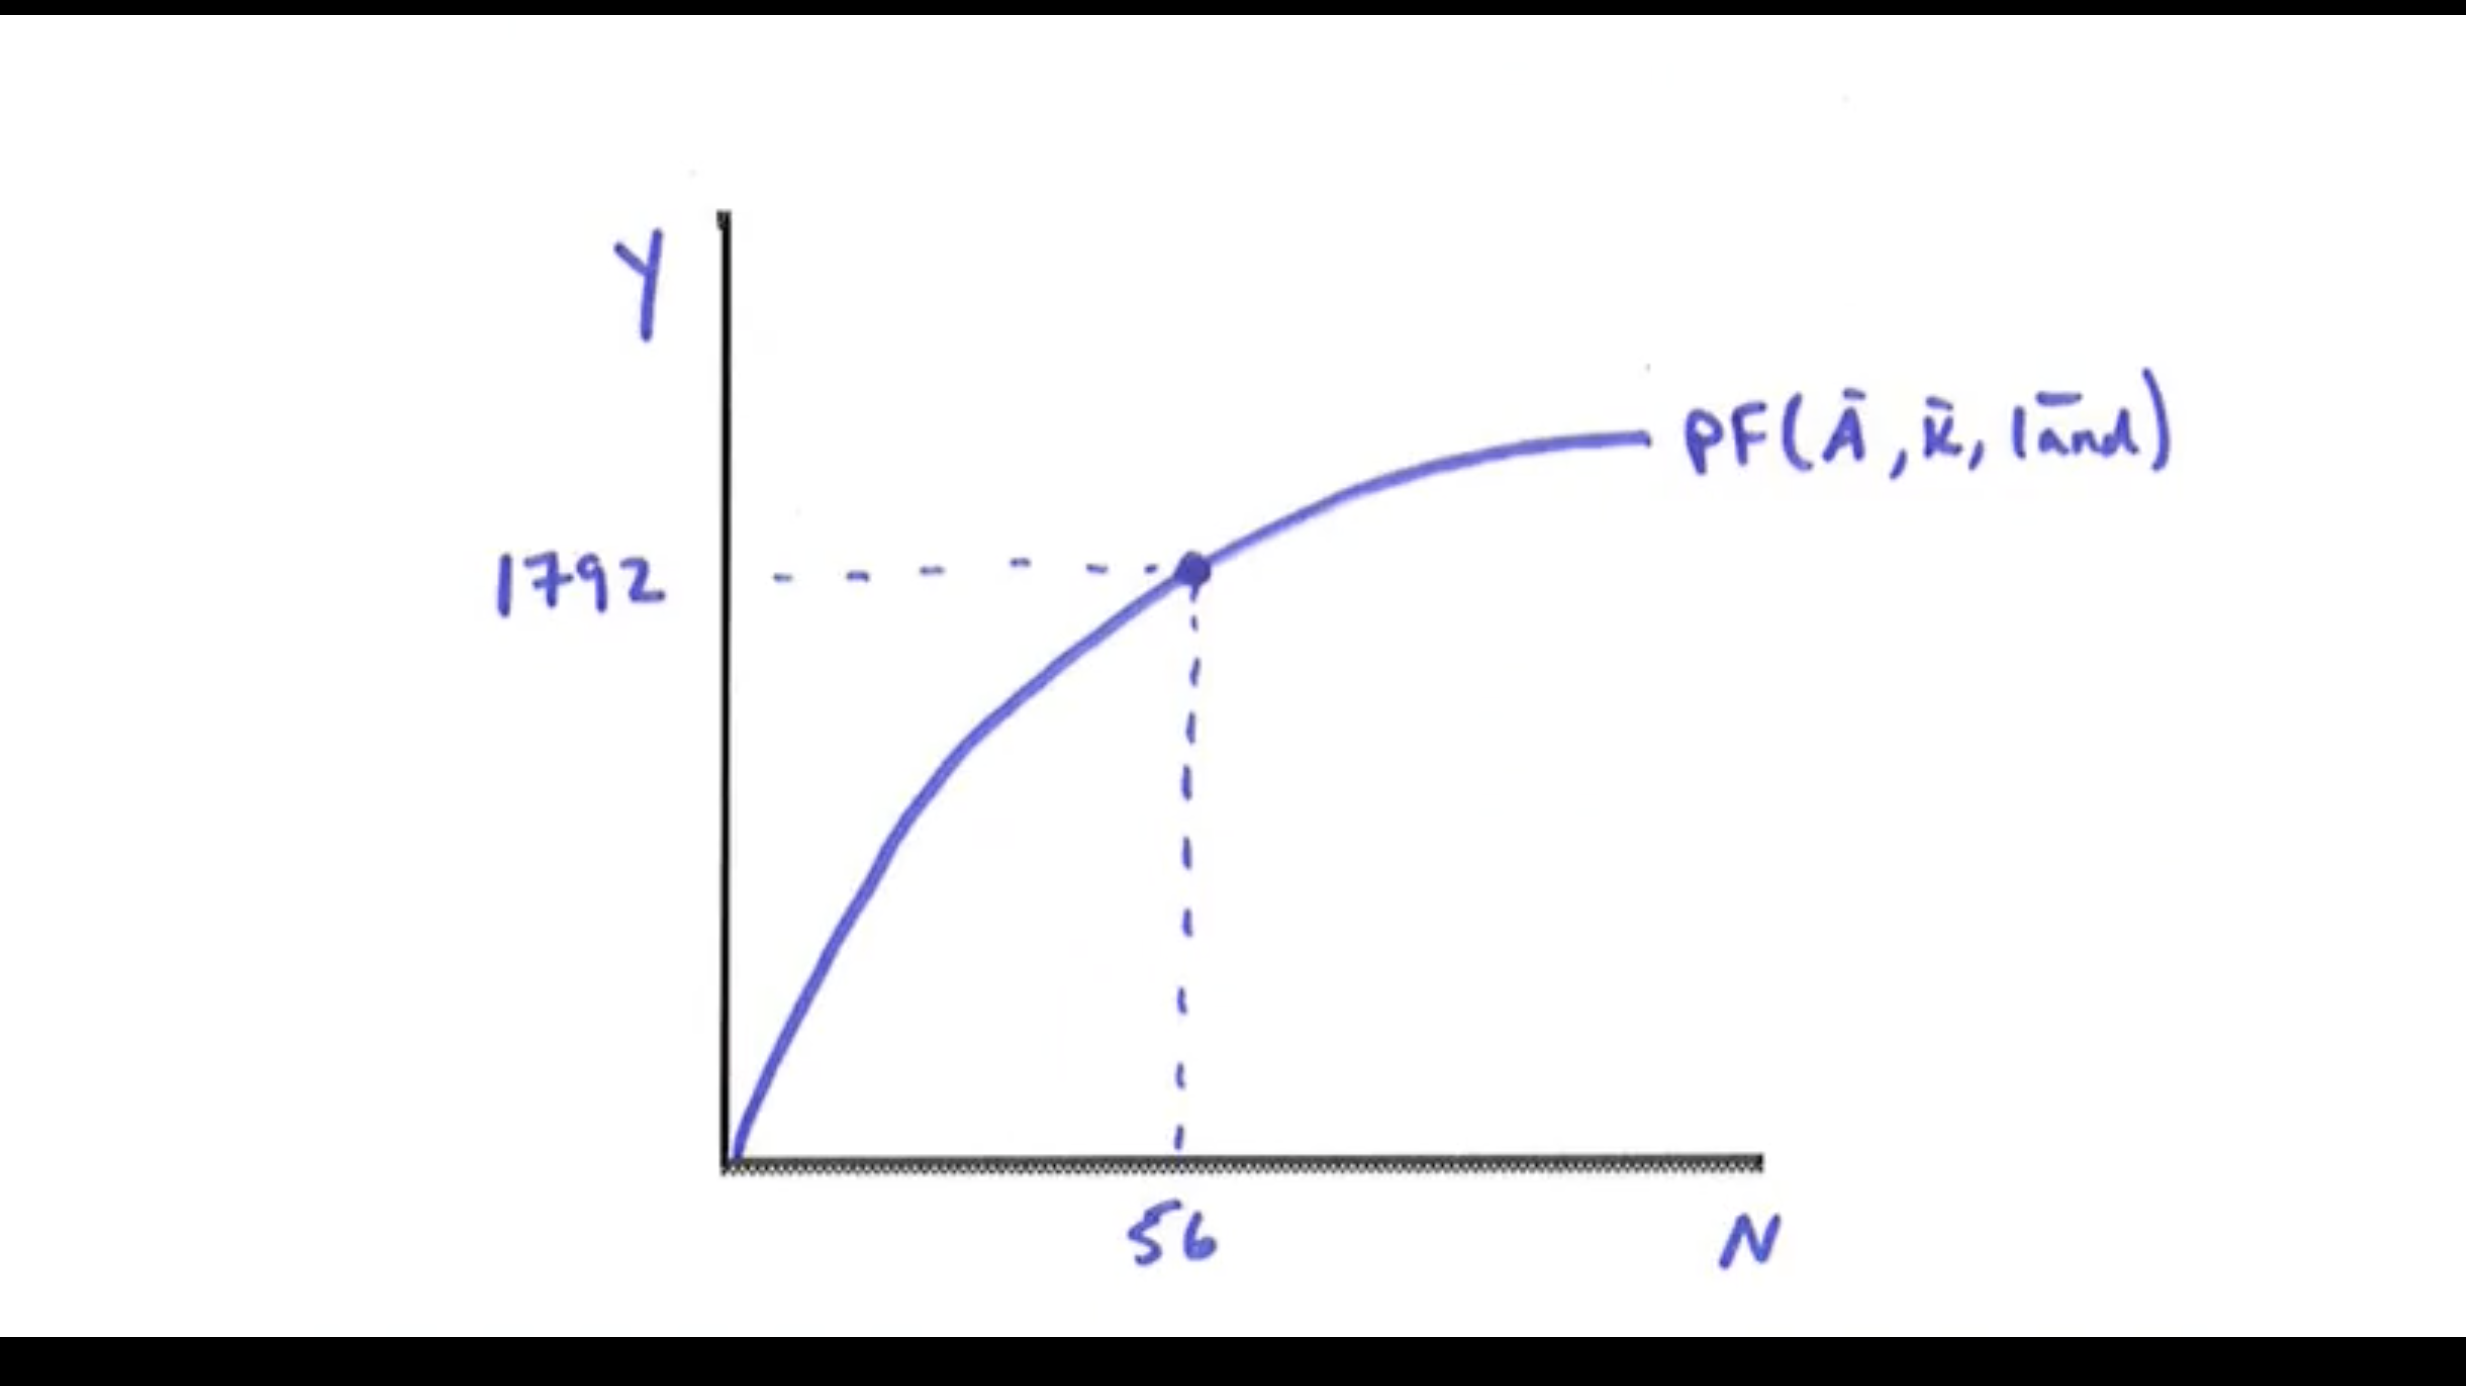
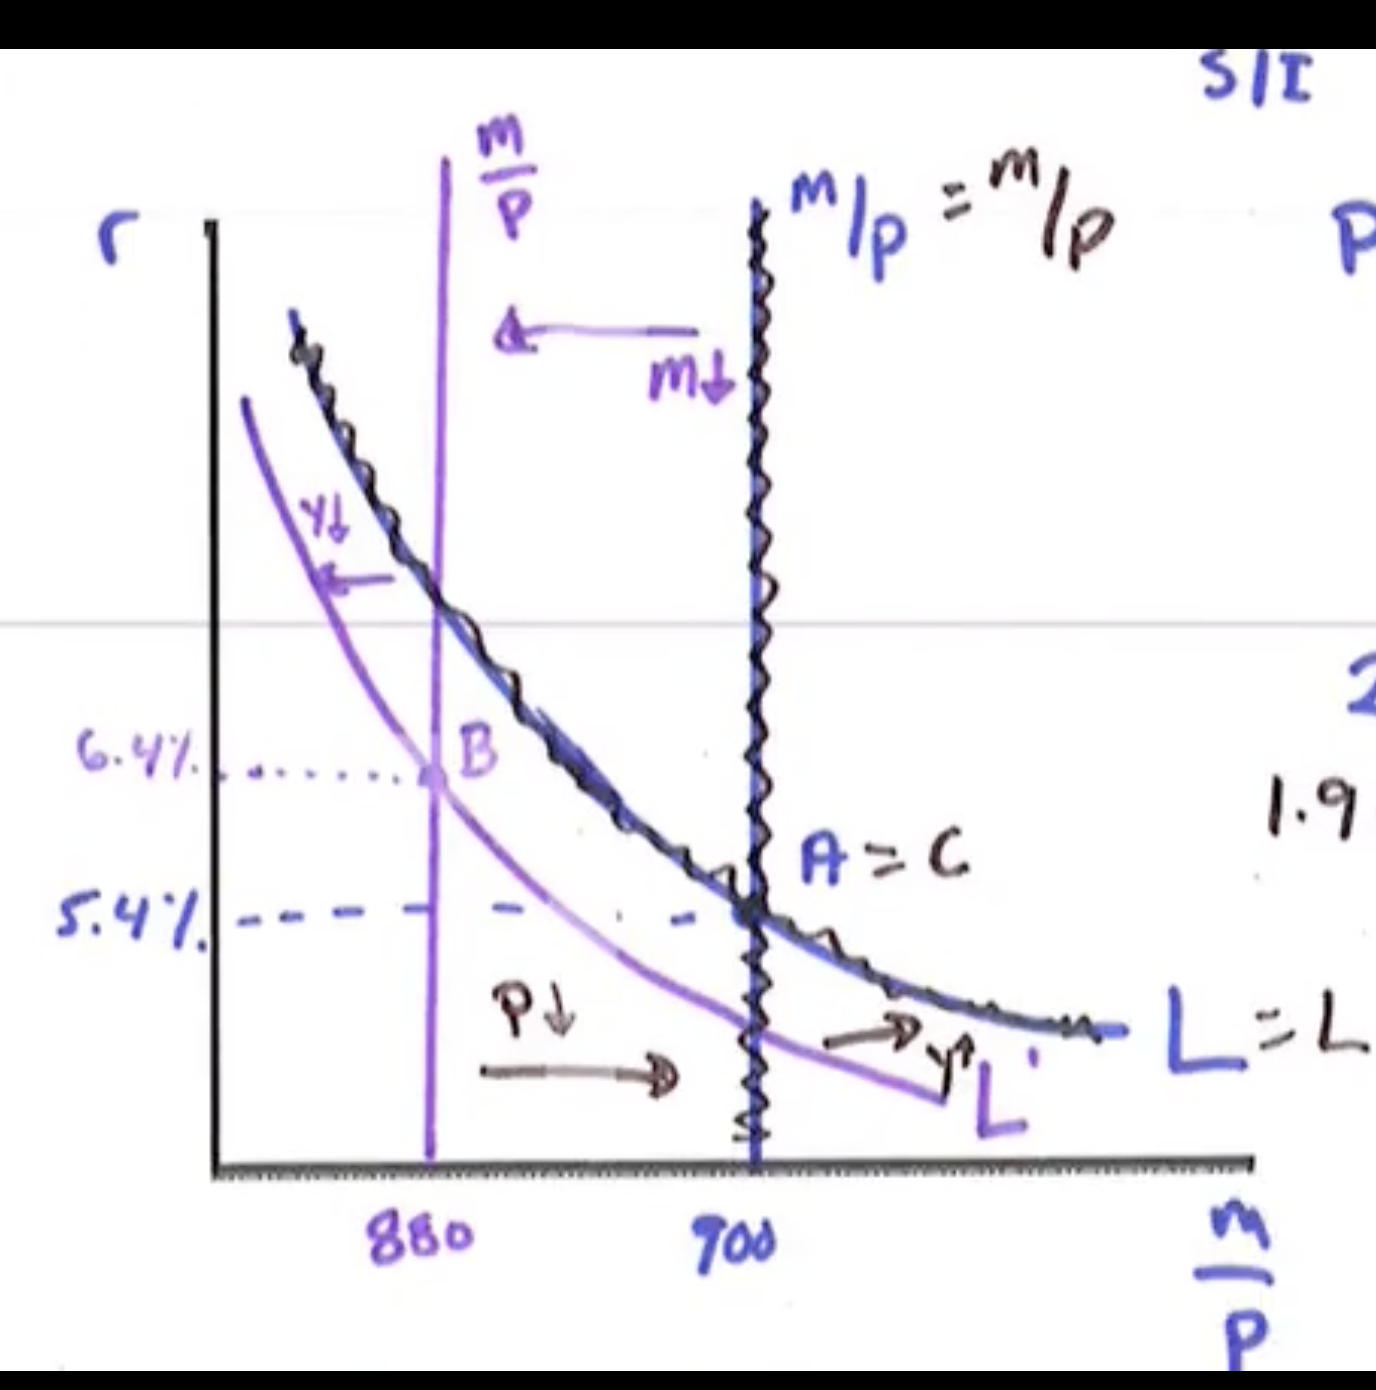

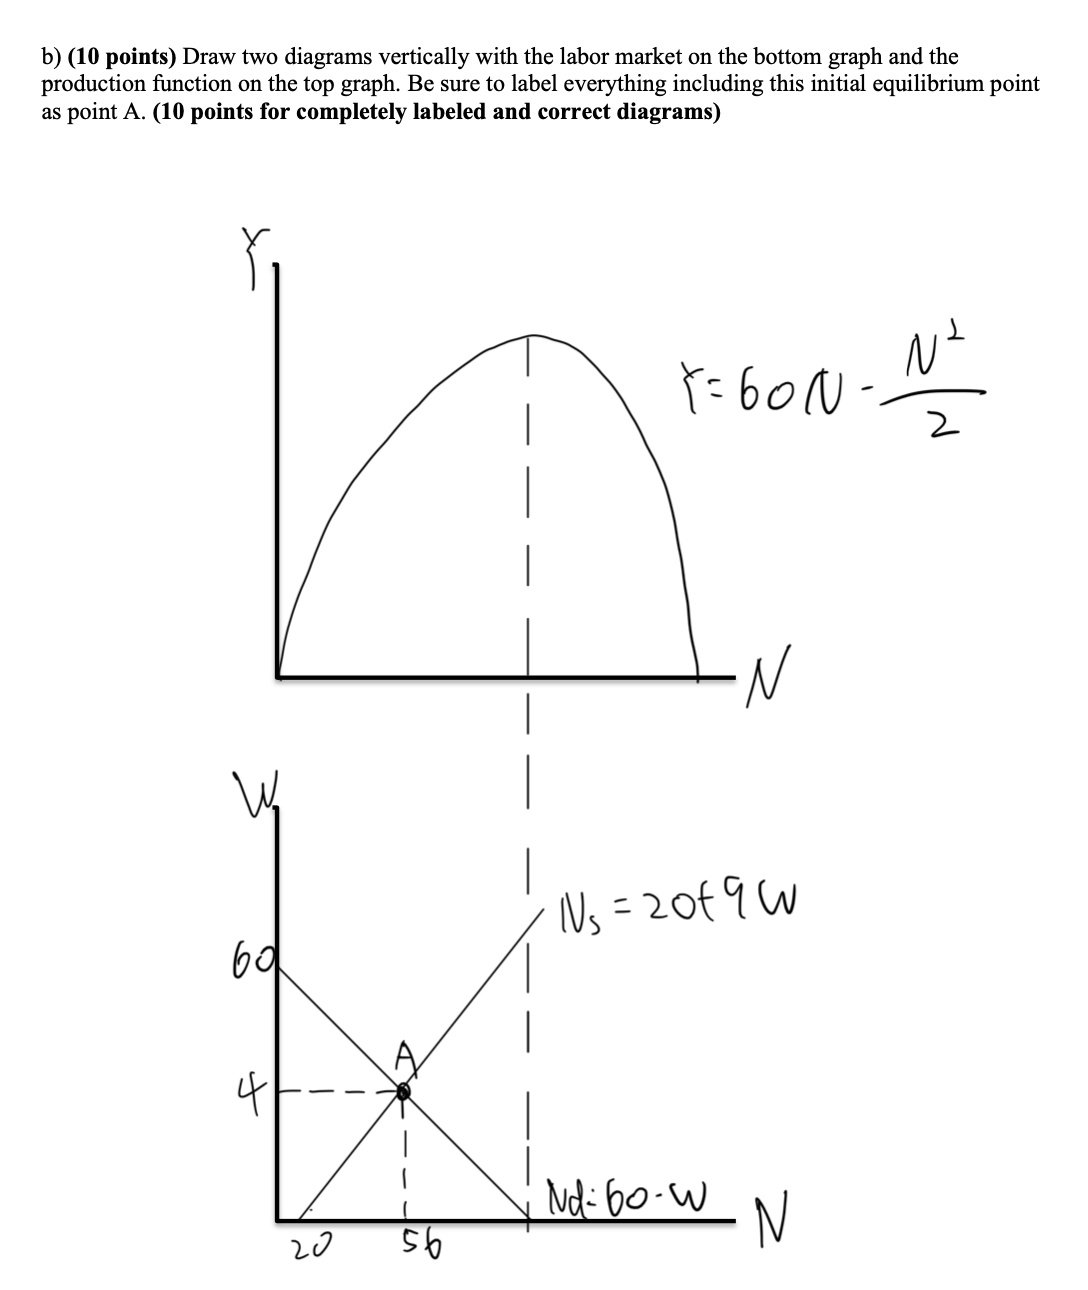


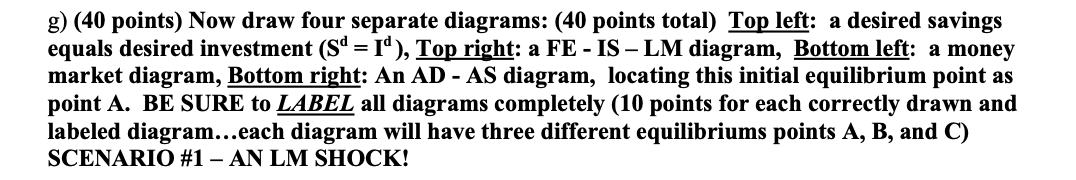


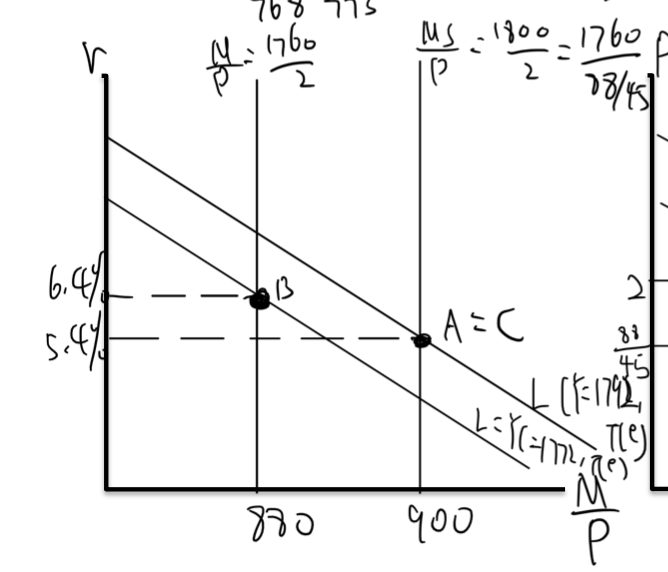

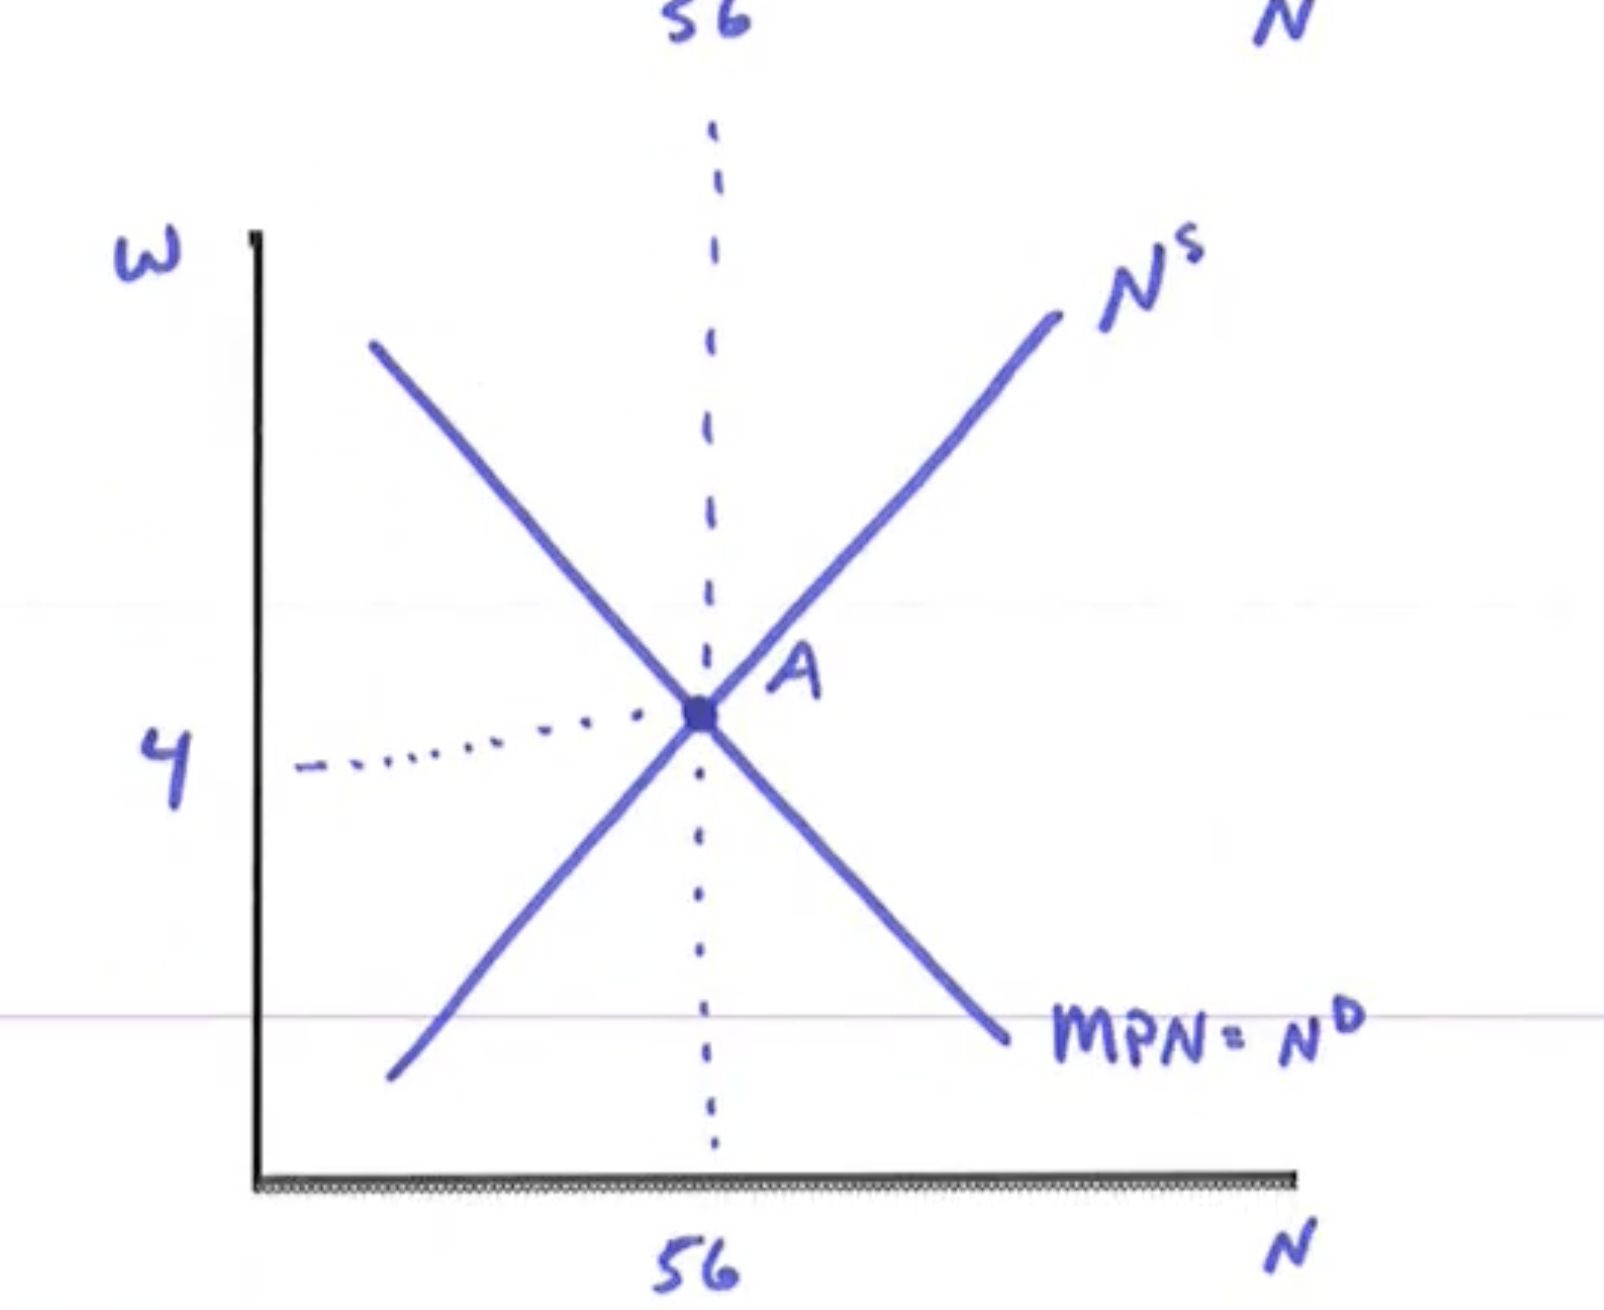
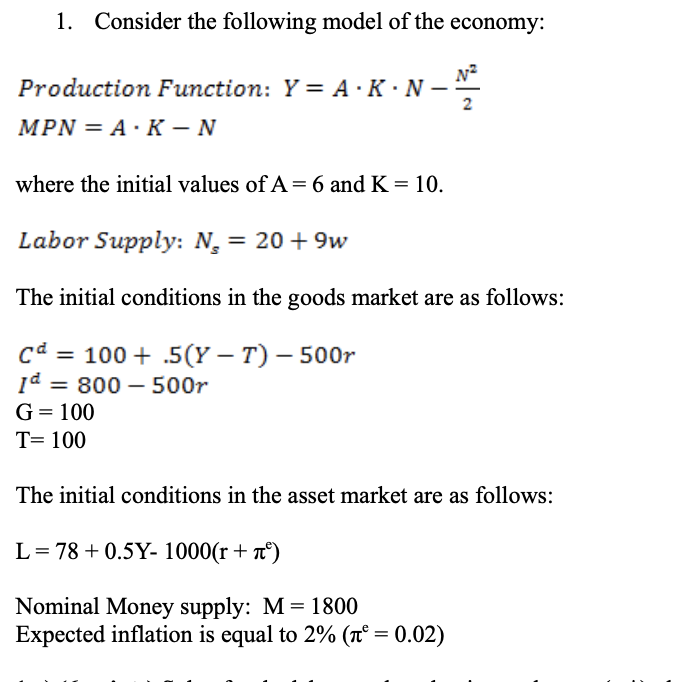

\fb) (10 points) Draw two diagrams vertically with the labor market on the bottom graph and the production motion on the top graph. Be sure to label everything including this initial equilibrium point as point A. (10 points for completely labeled and correct diagrams) T \f1. Consider the following model of the economy: Production Function: Y = A -K - N I; MPN = A - K N where the initial values of A = 6 and K = 10. Labor Supply: N, = 20 + 9w The initial conditions in the goods market are as follows: C'1 = 100 + .5(Y T) 5001- 1\" = 300 soar G= 100 T=100 The initial conditions in the asset market are as follows: L = 78 + 0.5Y- 1000(r + 75") Nominal Money supply: M = 1800 Expected ination is equal to 2% (atE = 0.02) g) (40 points) Now draw four separate diagrams: (40 points total) Ton left: a desired savings equals desired investment (S'1 = I'1 ), Ton ght: a FE - IS LM diagram, Bottom left: a money market diagram, Bottom right: An AD - AS diagram, locating this initial equilibrium point as point A, BE SURE to LABEL all diagrams completely (10 points for each correctly drawn and labeled diagram. ..each diagram will have three different equilibriums points A, B, and C) SCENARIO #1 AN LM SHOCK
Step by Step Solution
There are 3 Steps involved in it

Get step-by-step solutions from verified subject matter experts