Question: ffTopic 2 Link 1 Link 2 Hypothesis Reasoning Statistics Canada, Table 10-10- 0011-01 Value of sales of alcoholic beverages of liquor Statistics Canada. Table As
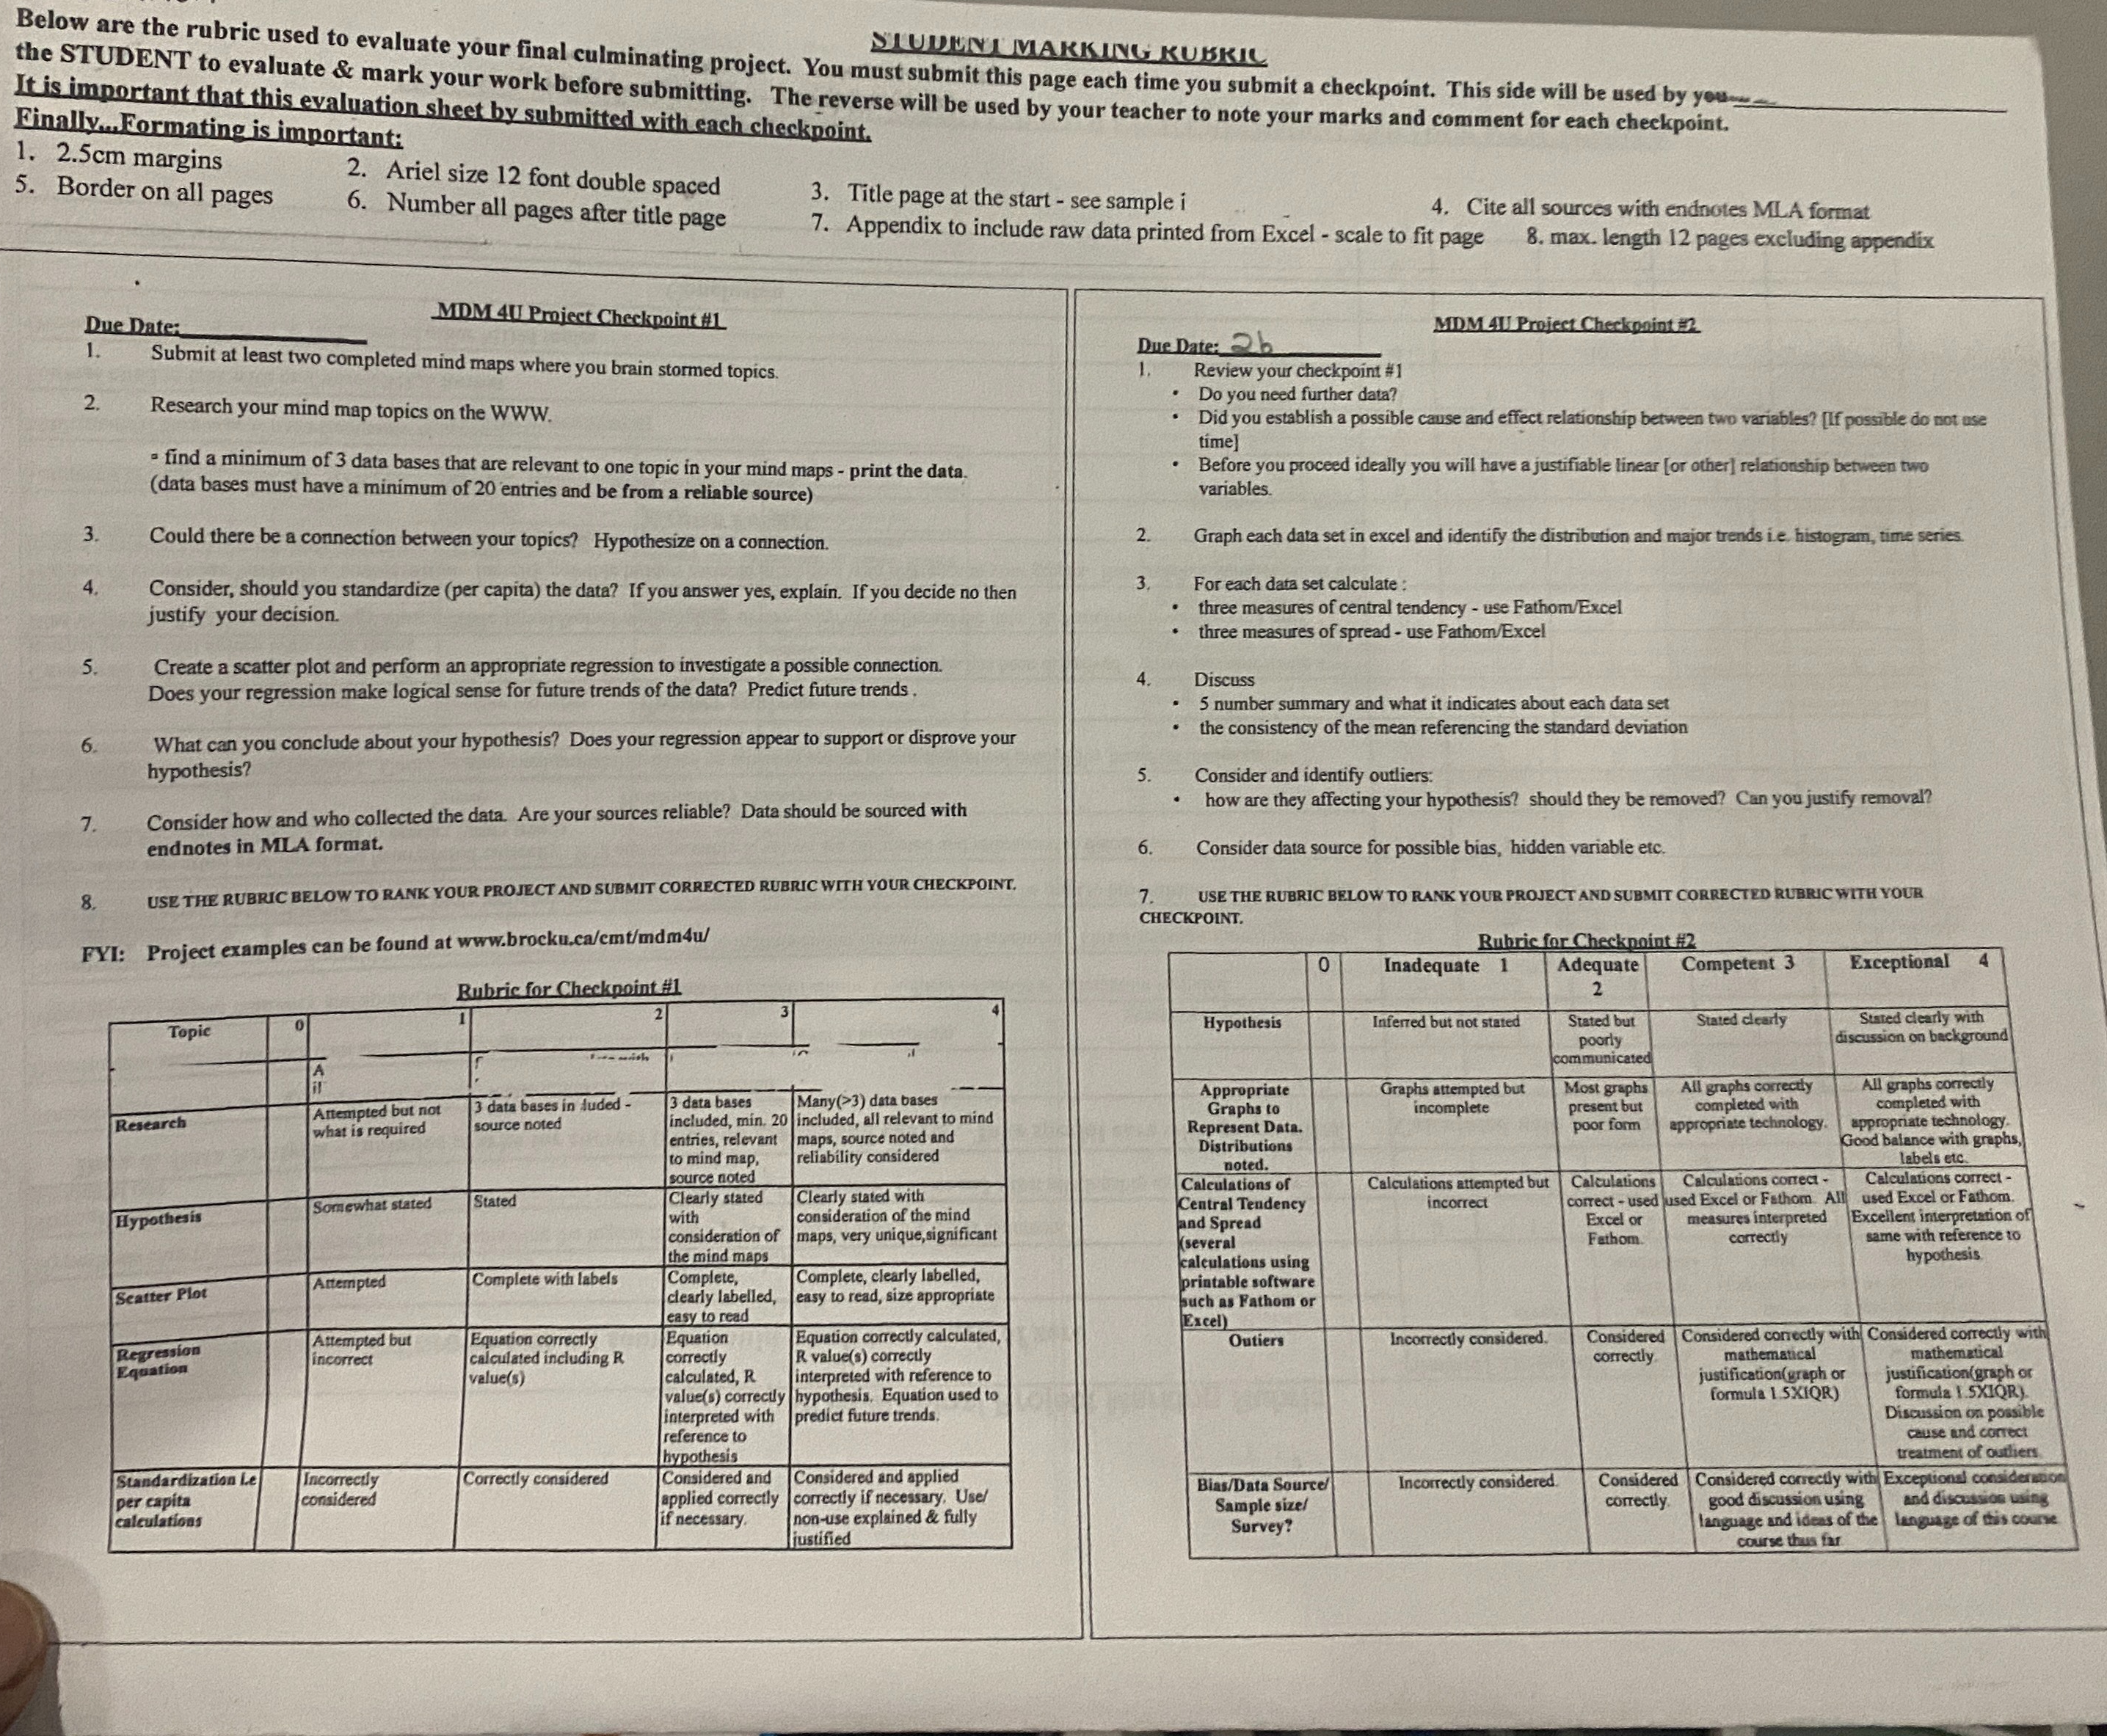
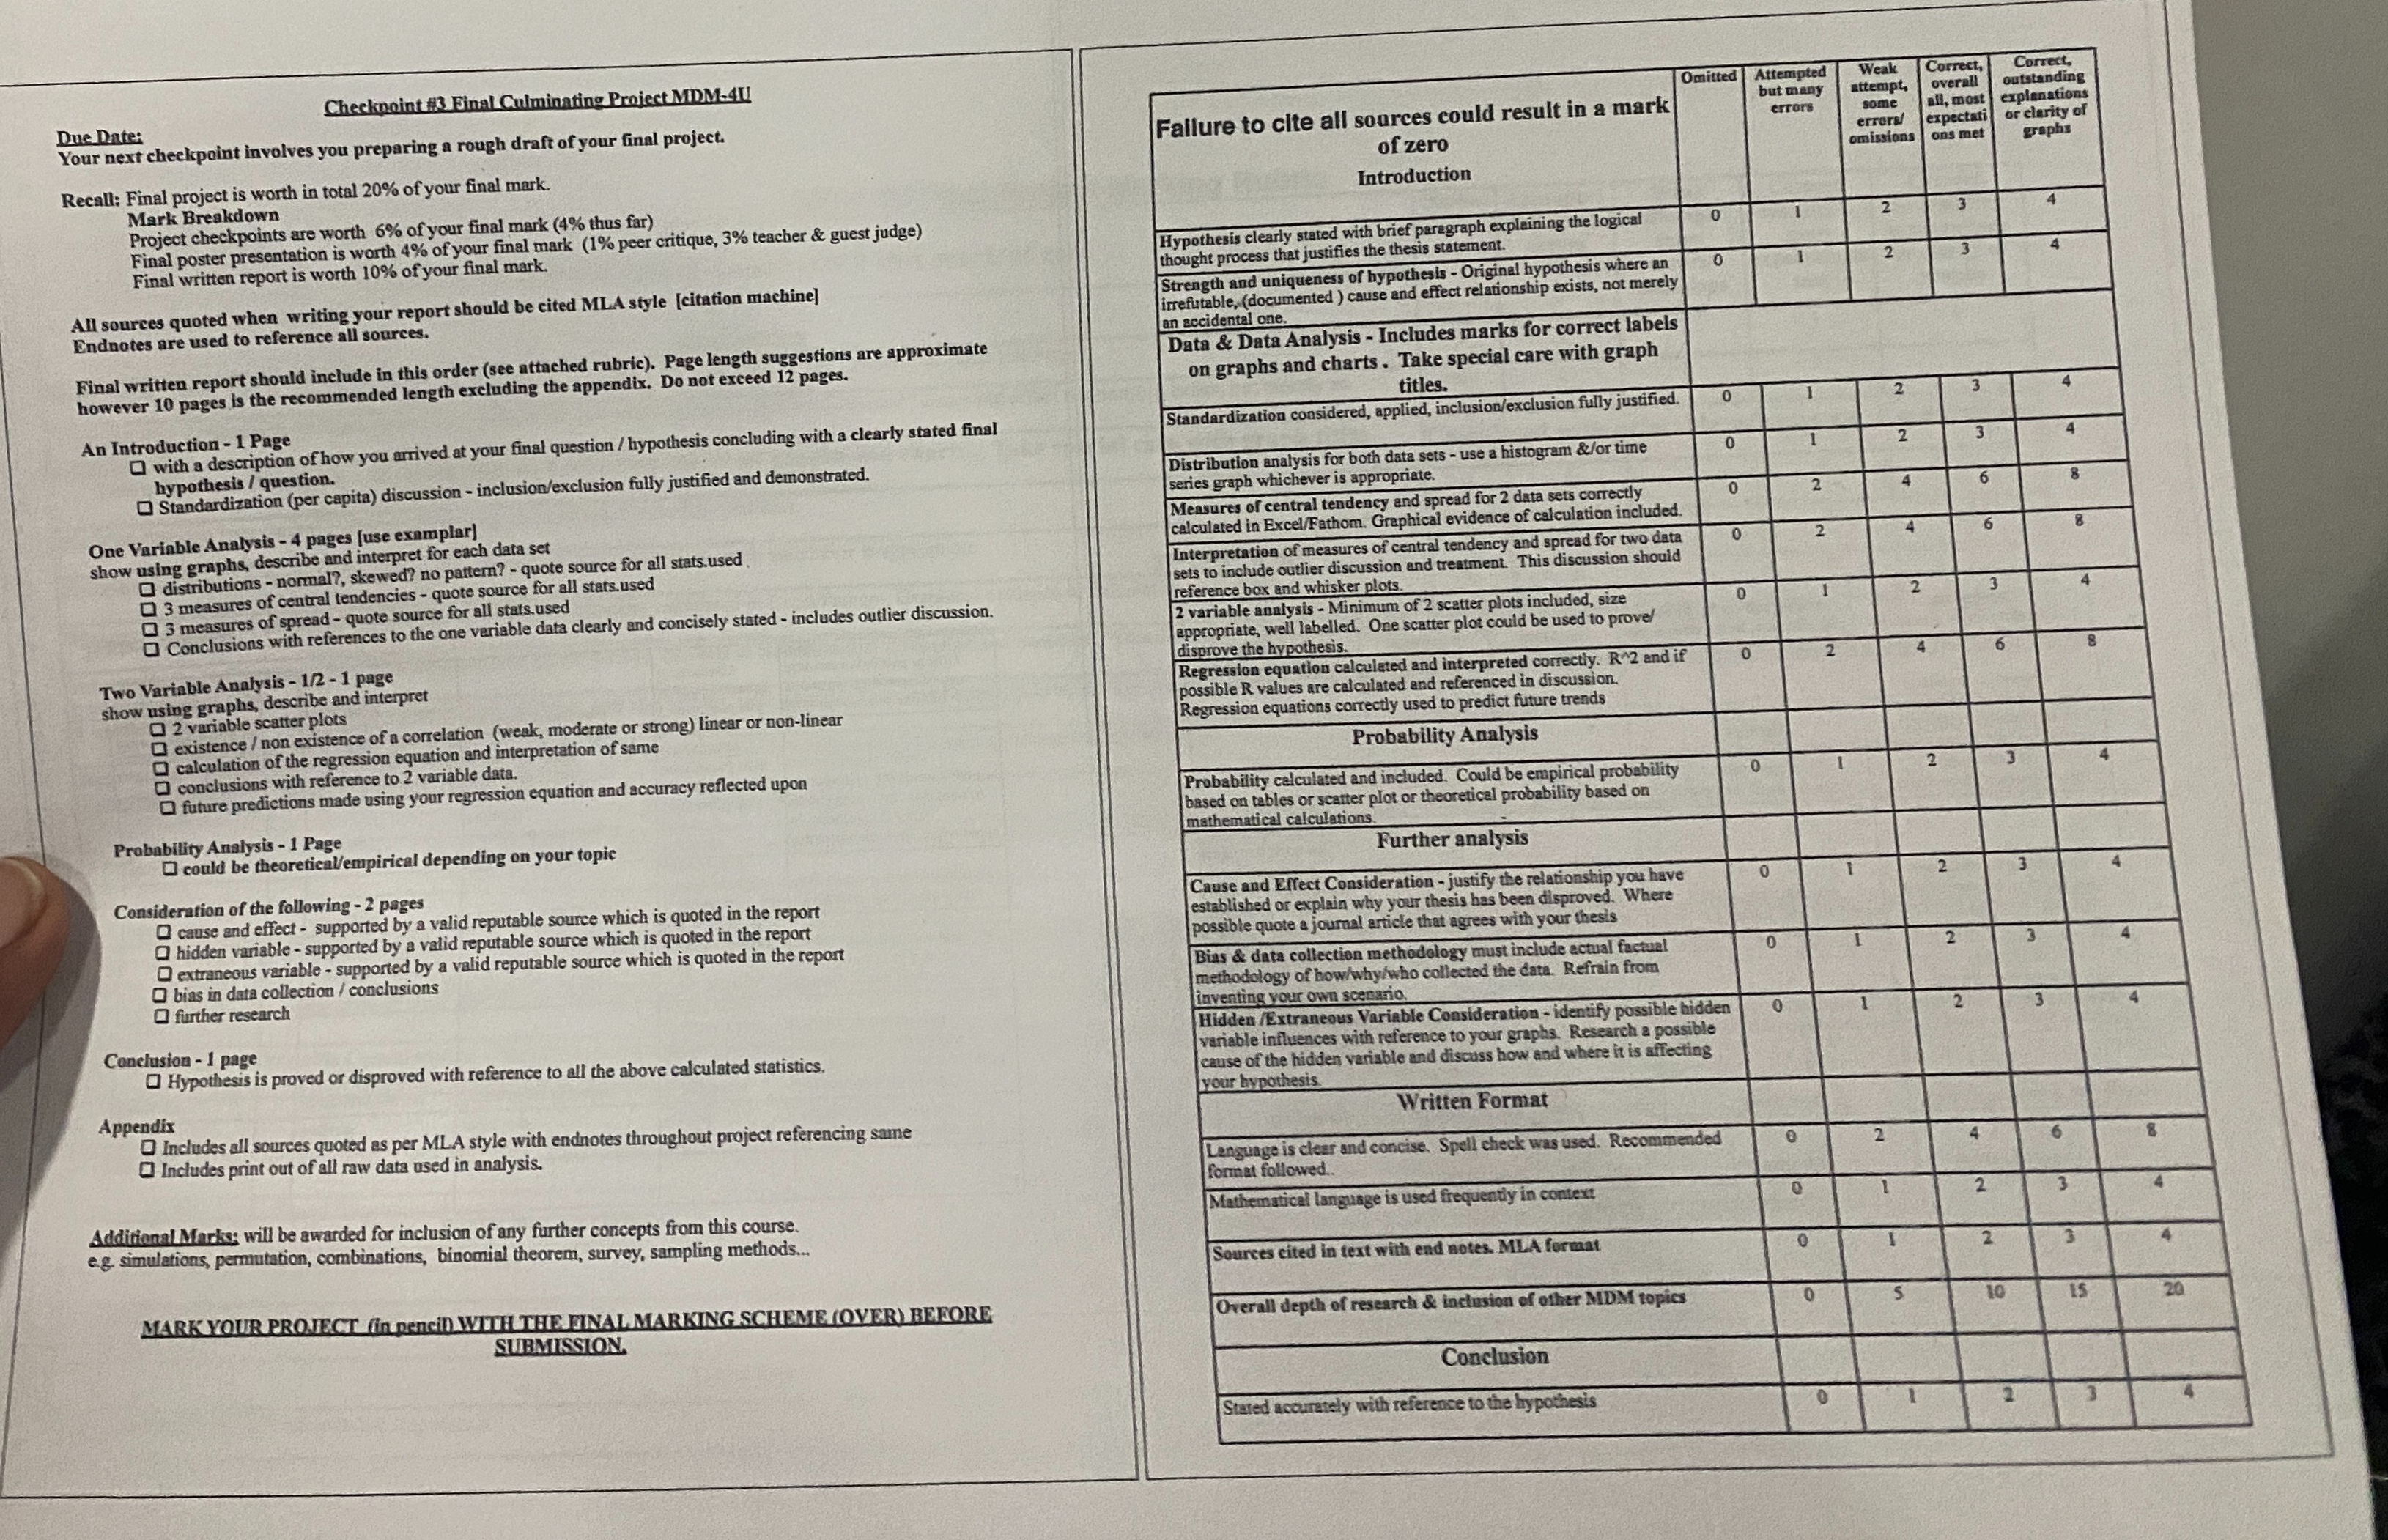
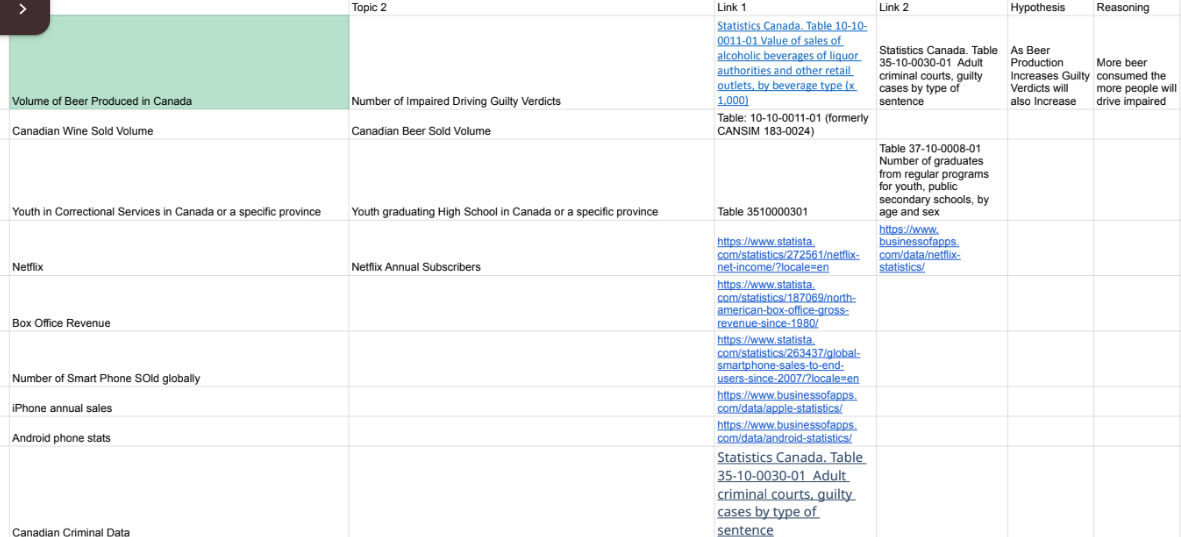
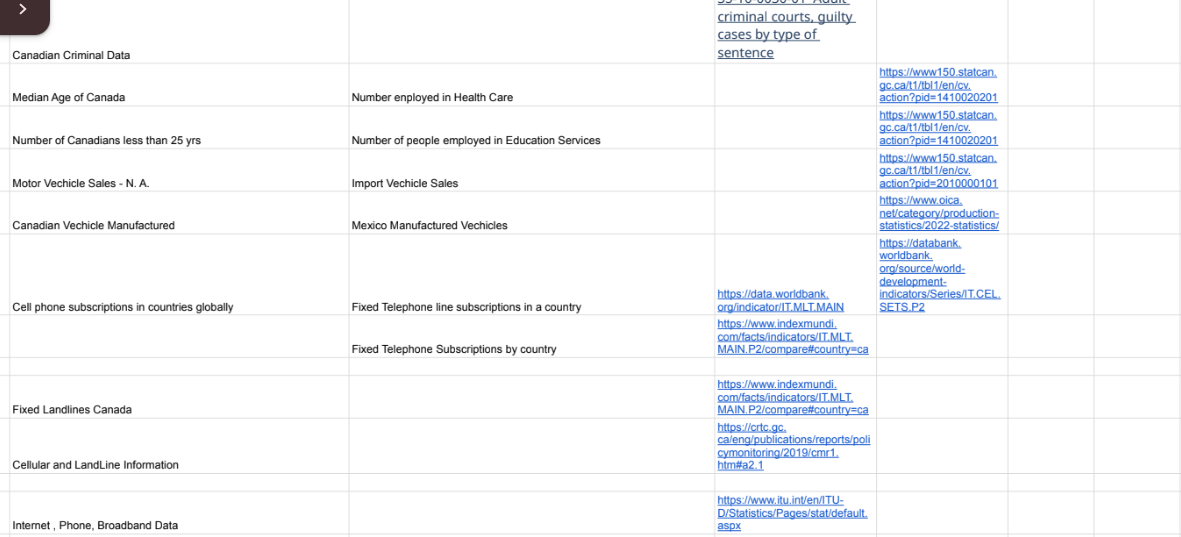
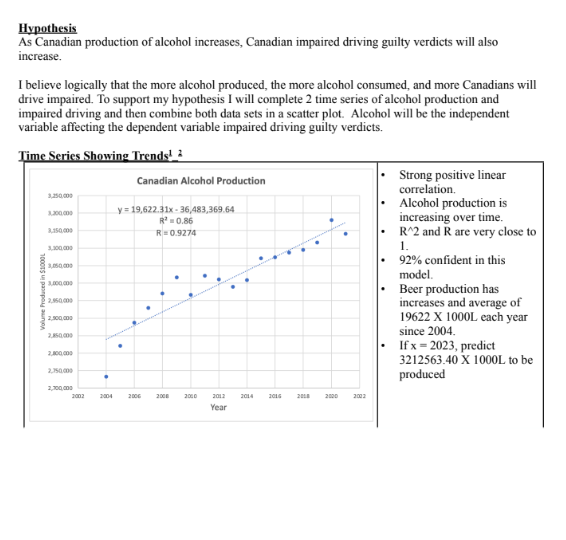
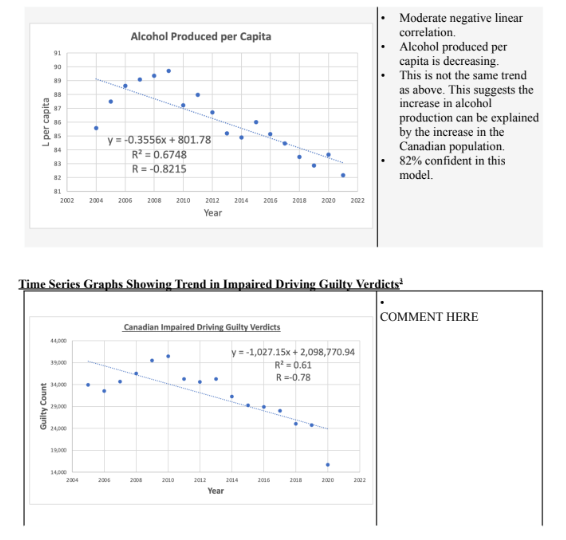
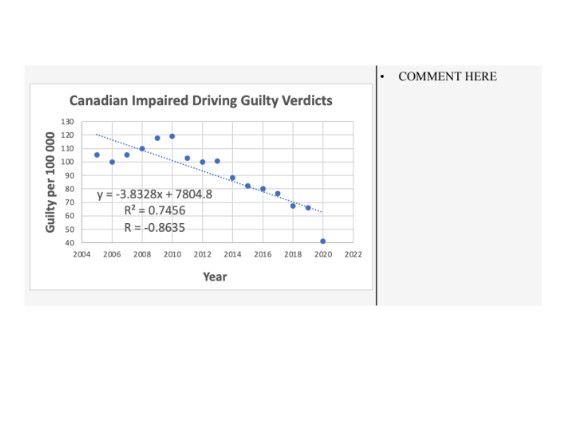
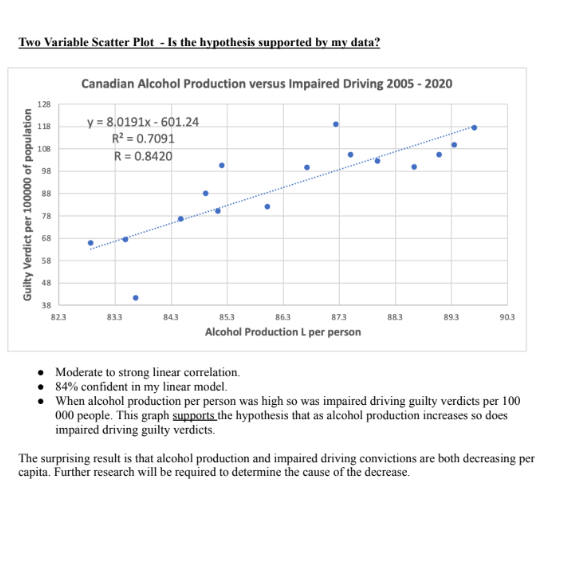
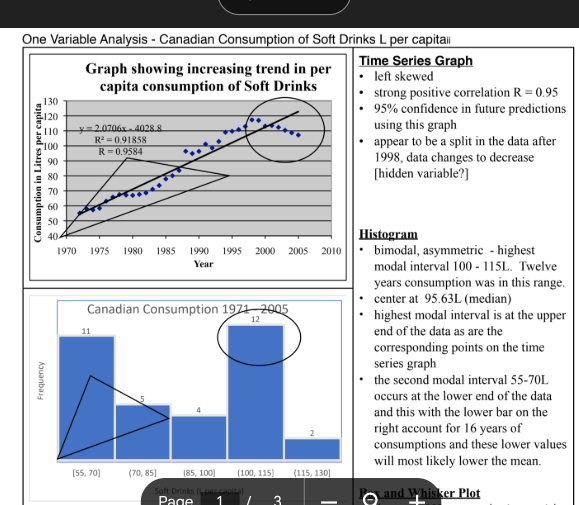
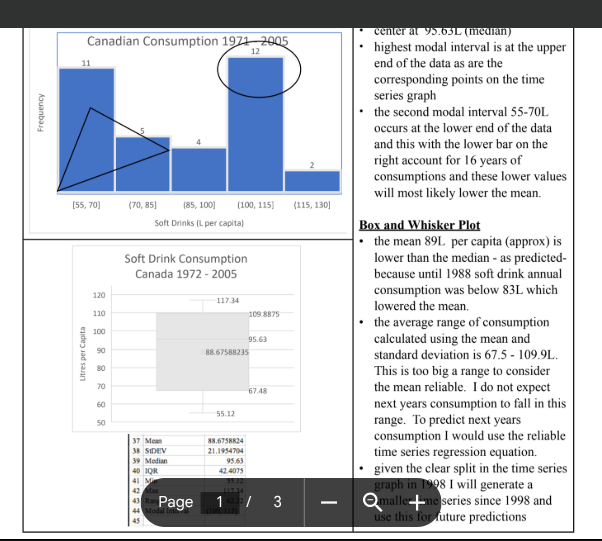
\f\fTopic 2 Link 1 Link 2 Hypothesis Reasoning Statistics Canada, Table 10-10- 0011-01 Value of sales of alcoholic beverages of liquor Statistics Canada. Table As Beer 35-10-0030-01 Adult Production More beer authorities and other retail criminal courts, guilty Increases Guilty consumed the outlets, by beverage type (x cases by type of Verdicts will more people will Volume of Beer Produced in Canada Number of Impaired Driving Guilty Verdicts 1,000) sentence also Increase drive impaired Table: 10-10-0011-01 (formerly Canadian Wine Sold Volume Canadian Beer Sold Volume CANSIM 183-0024) Table 37-10-0008-01 Number of graduates from regular programs for youth, public secondary schools, by Youth in Correctional Services in Canada or a specific province Youth graduating High School in Canada or a specific province Table 3510000301 age and sex https:/www. https://www.statista. businessofapps. com/statistics/272561etflix- com/dataetflix- Netflix Netflix Annual Subscribers net-income/?locale=en statistics/ https://www.statista. com/statistics/187069orth- american-box-office-gross- Box Office Revenue revenue-since-1980/ https://www.statista. com/statistics/263437/global- smartphone-sales-to-end- Number of Smart Phone SOld globally users-since-2007/?locale=en https://www.businessofapps. Phone annual sales com/data/apple-statistics/ https://www.businessofapps. Android phone stats com/data/android-statistics/ Statistics Canada. Table 35-10-0030-01 Adult criminal courts, guilty cases by type of sentencecriminal courts, guilty cases by type of Canadian Criminal Data sentence https://www150.statcan. gc.ca/t1/tbl1/en/cv. Median Age of Canada Number enployed in Health Care action?pid=1410020201 https://www150.statcan. gc.ca/t1/tbl1/en/cv. Number of Canadians less than 25 yrs Number of people employed in Education Services action?pid=1410020201 https://www150.statcan. gc.ca/t1/tbl1/en/cv. Motor Vechicle Sales - N. A. Import Vechicle Sales action?pid=2010000101 https://www.oica. net/category/production: Canadian Vechicle Manufactured Mexico Manufactured Vechicles statistics/2022-statistics/ https://databank. worldbank. org/source/world- development https://data.worldbank. indicators/Series/IT.CEL. Cell phone subscriptions in countries globally Fixed Telephone line subscriptions in a country org/indicator/IT.MLT.MAIN SETS.P2 https://www. indexmundi, com/facts/indicators/IT.MLI. Fixed Telephone Subscriptions by country MAIN. P2/compare#country ca https://www.indexmundi. com/facts/indicators/IT.MLT. Fixed Landlines Canada MAIN. P2/compare#country=ca https://crtc.gc. caleng/publications/reports/poli cymonitoring/2019/cmr1 Cellular and LandLine Information htm#a2.1 https://www.itu.int/en/ITU- D/Statistics/Pages/stat/default. Internet , Phone, Broadband Data aspxhttps://www.indexmundi. com/facts/indicators/IT.MLT. Fixed Landlines Canada MAIN.P2/compare#country=ca https://cric.gc. ca/eng/publications/reports/poli cymonitoring/2019/cmr1. Cellular and LandLine Information htm#a2.1 https://www.itu.int/en/ITU- D/Statistics/Pages/stat/default. Internet , Phone, Broadband Data aspx https://www.statista. com/statistics/436573/rx-and- Spending on Prescription Drugs in Canada non-rx-drug-spending-canada/ https://publications.gc. calcollections/collection_2013/ Prescription Drugs from P. 24 cis-cihl/H115-27-2012-eng.pdfhttps:/secure.cihi. ca/free products/prescribed- drug-spending-in-canada-2020- Prescription Drugs 2020 report-en.pdf https://www.macrotrends. net/stocks/charts/NTDOYinte Nintendo Profits ndoet-income https://www.pokeguardian. com/934991 over-9-billion- pokemon-cards-sold-in-fiscal- POKEMON Cards year-2021-2022 https:/www.dexerto. com/pokemon/how-many- pokemon-cards-are-there-all- sets-released-so-far-1784998/ https://www.bigorbitcards.co. uk/blog/the-history-of- History of Pokemon pokemon-tog a postive trend in the greater diversity of religions within canada https://www150.statcan.gc. https://www150.statcan. ca/t1/tb/1/en/tv.action? gc.ca/t1/tbl1/en/tv. Population in homless shelters Unemployment rate pid=1410035301 action?pid=1410032702 Number of divorces Live Birth and Stillbirths https://www150.statcan.gc.ca/t1/bl1/en/cv.action?pid=3910005101As Canadian production of alcohol increases, Canadian impaired driving guilty verdicts will also Increase. [ believe logically that the more alcohol produced, the more alcohol consumed, and more Canadians will drive impaired. To support my hypothesis | will complete 2 time serves of alcohol production and impaired driving and then combine both data sets in a scatter plot. Alcohol will be the independent variable affecting the dependent variable impaired driving guilty verdicts. Bs ? E E. R = 2 50 Oth 1a Canadian Alcohol Production y= 19,622,310 = 36,485,369.64 A? 2 0.86 R= O92 7a Strong positive linear correlation, Alcohol production is increasing over time. R2 and R are very close to i. 97% confident in this model. Beer production has increases and average of 19622 X LOOOL each year since 2004. Ifx = 2023, predict 3212563.40 X 1O00L to be produced Moderate negative linear Alcohol Produced per Capita correlation, Alcohol produced per capita is decreasing. This is not the same trend as above. This suggests the increase in alcohol L per capita production can be explained V = -0.3556x + 801.78 by the increase in the Canadian population. R= 0.6748 82% confident in this R = -0.8215 model. 2002 20304 2006 2008 2010 2012 20314 2016 2418 2010 2022 Year Time Series Graphs Showing Trend in Impaired Driving Guilty Verdicts' COMMENT HERE Canadian Impaired Driving Guilty Verdicts y = -1,027.15x + 2,098,770.94 R* = 0.61 R = 0.78 Guilty Count 3004COMMENT HERE Canadian Impaired Driving Guilty Verdicts 130 120 110 100 90 Guilty per 100 000 BO V=-3.8328x + 7804.8 70 R? = 0.7456 60 SO R = -0.8635 40 2004 2006 2008 2010 2012 2014 2016 2018 2020 2022 YearTwo Variable Scatter Plot - Is the hypothesis supported by my data? Canadian Alcohol Production versus Impaired Driving 2005 - 2020 12 1 18 y = 8.0191x - 601.24 R2 = 0.7091 108 R = 0.8420 98 88 Guilty Verdict per 100000 of population 78 68 58 38 83 3 843 85.3 86.3 873 903 Alcohol Production L per person Moderate to strong linear correlation. 84% confident in my linear model. When alcohol production per person was high so was impaired driving guilty verdicts per 100 000 people. This graph supports the hypothesis that as alcohol production increases so does impaired driving guilty verdicts. The surprising result is that alcohol production and impaired driving convictions are both decreasing per capita. Further research will be required to determine the cause of the decrease.One Variable Analysis - Canadian Consumption of Soft Drinks L per capitaii Graph showing increasing trend in per Time Series Graph . left skewed capita consumption of Soft Drinks strong positive correlation R = 0.95 130 $120 95% confidence in future predictions 110 y- 2 0706x - 4028.8 using this graph 100 R = 0,91858 appear to be a split in the data after R = 0.9584 1998, data changes to decrease Consumption in Litres per capita [hidden variable?] Histogram 1970 1975 1980 1985 1990 1995 2000 2005 2010 bimodal, asymmetric - highest Year modal interval 100 - 115L. Twelve years consumption was in this range. Canadian Consumption 1971-2005 center at 95.63L (median) 12 highest modal interval is at the upper 11 end of the data as are the corresponding points on the time series graph Frequency the second modal interval 55-70L occurs at the lower end of the data and this with the lower bar on the 2 right account for 16 years of consumptions and these lower values will most likely lower the mean. [55, 70] (70, 85] (85, 100] [100, 115) (115, 130] Soft Drinks | per Pane and Whisker PlotCanadian a | 11 i. ) (55, 70] (70, 85] (85, 100) (100, 115! (115, 130] Frequency Sort Drinks [iL per capital Soft Drink Consumption Canada 1972 - 2005 95.6) BSG SHHY dS 48 875RR24 21,54 8 42.5075 COner g D ral highest modal interval is at the upper end of the data as are the corresponding points on the time series graph the second modal interval 55-70L occurs at the lower end of the data and this with the lower bar on the right account for 16 years of consumptions and these lower values will most likely lower the mean. B 1 Whisker Plot + the mean 891. per capita (approx) is lower than the median - as predicted- because until 1988 soft drink annual consumption was below 83L which lowered the mean. the average range of consumption calculated using the mean and standard deviation is 67.5 - 109.9L. This is too big a range to consider the mean reliable. I do not expect next years consumption to fall in this range. To predict next years consumption | would use the reliable lime series regression equation. * given the clear split in the time series 08 | will generate a Series since 1998 and uture predictions
Step by Step Solution
There are 3 Steps involved in it
1 Expert Approved Answer
Step: 1 Unlock
Question Has Been Solved by an Expert!
Get step-by-step solutions from verified subject matter experts
Step: 2 Unlock
Step: 3 Unlock
Students Have Also Explored These Related Accounting Questions!