

Question: Fhggdhdgzfg Use the data given in the table to answer the following questions. The chart bel represents data from a study made to compare the
Fhggdhdgzfg
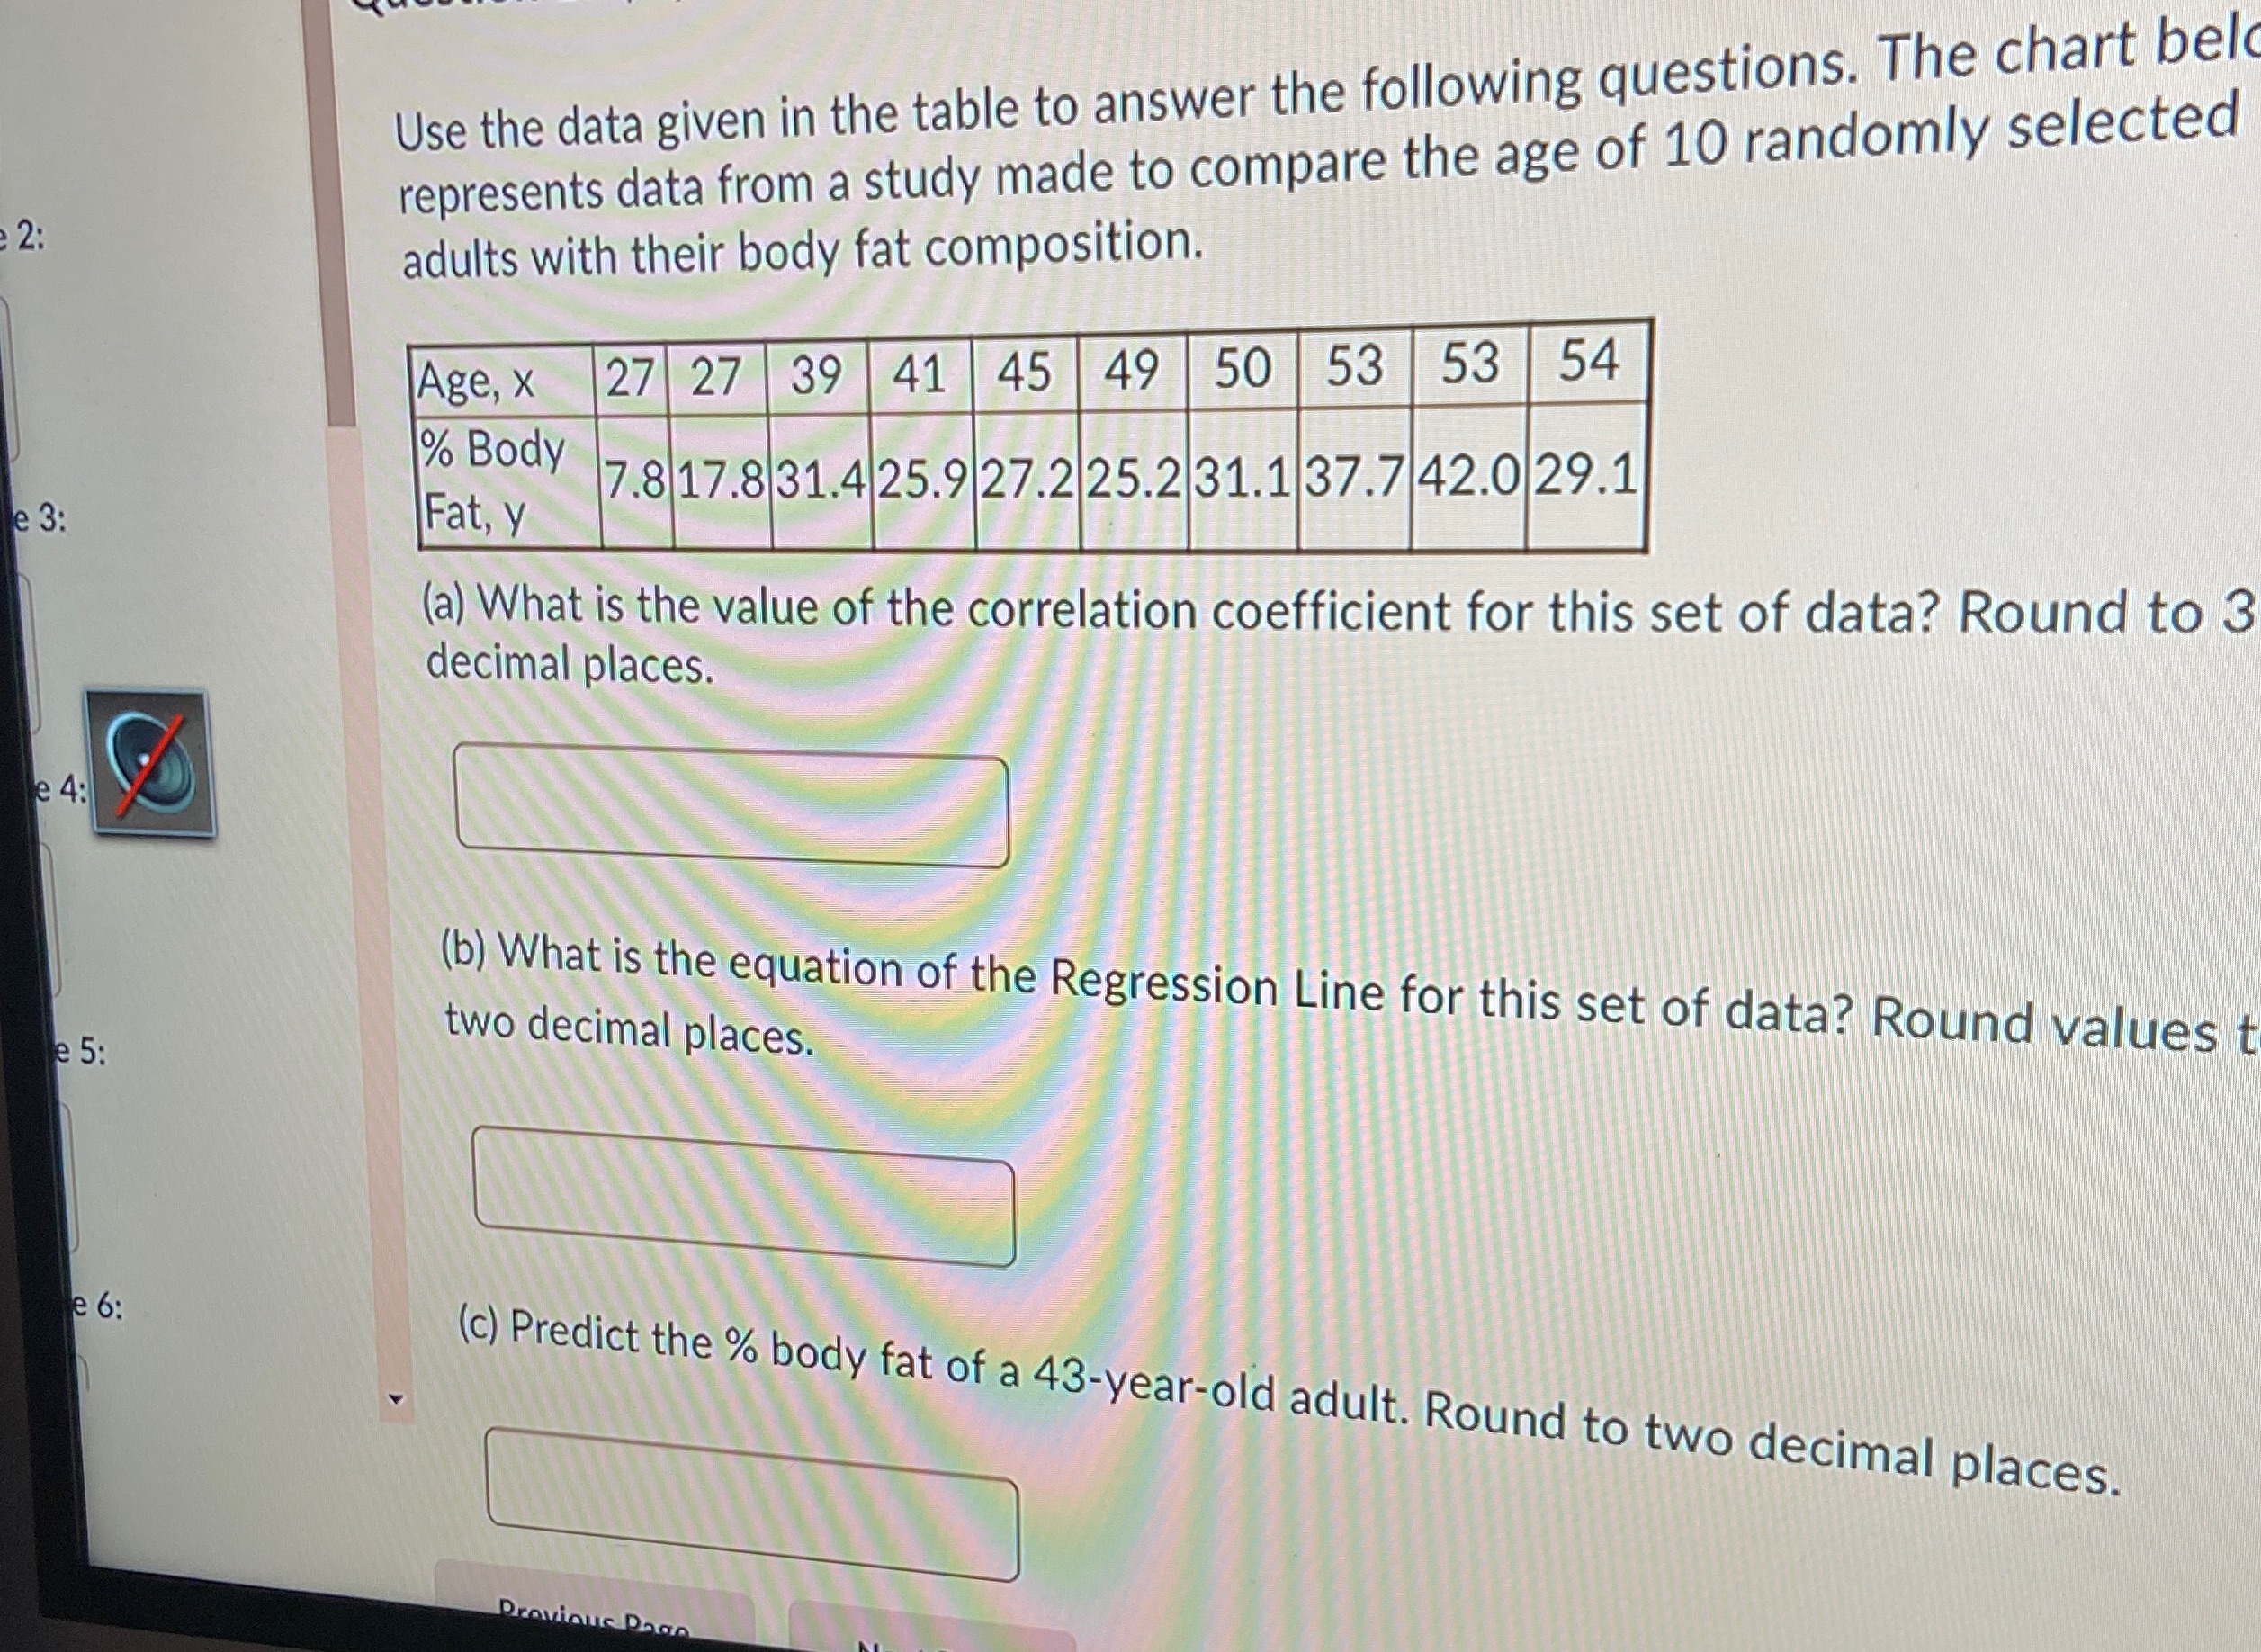
Use the data given in the table to answer the following questions. The chart bel represents data from a study made to compare the age of 10 randomly selected 2: adults with their body fat composition. Age, X 27 27 39 41 45 49 50 53 53 54 % Body le 3: Fat, y 7.8 17.8 31.4 25.9 27.2 25.2 31.1 37.7 42.0 29.1 (a) What is the value of the correlation coefficient for this set of data? Round to 3 decimal places. e 4: (b) What is the equation of the Regression Line for this set of data? Round values le 5: two decimal places. e 6: (c) Predict the % body fat of a 43-year-old adult. Round to two decimal places. Previous Dago
Step by Step Solution
There are 3 Steps involved in it

Get step-by-step solutions from verified subject matter experts