

Question: Fidelity Fund II is considering new stock selection analysis as follows: Stock A Stock B Nikkei (A,B) 6 month Tbill 1- E(R) Portfolio 1
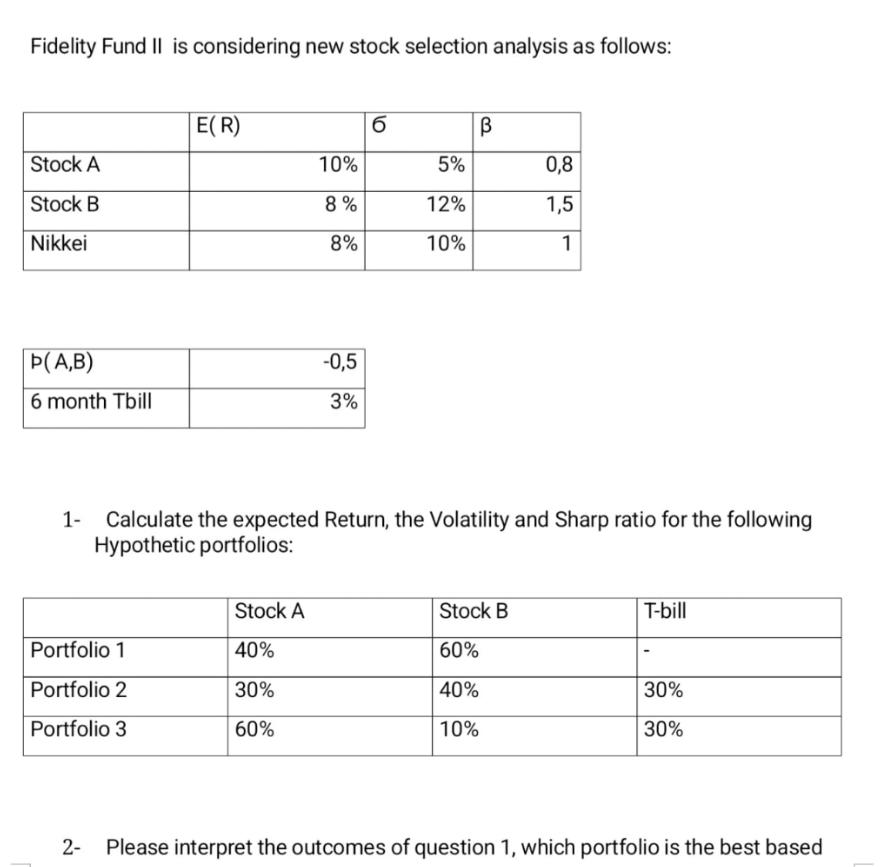
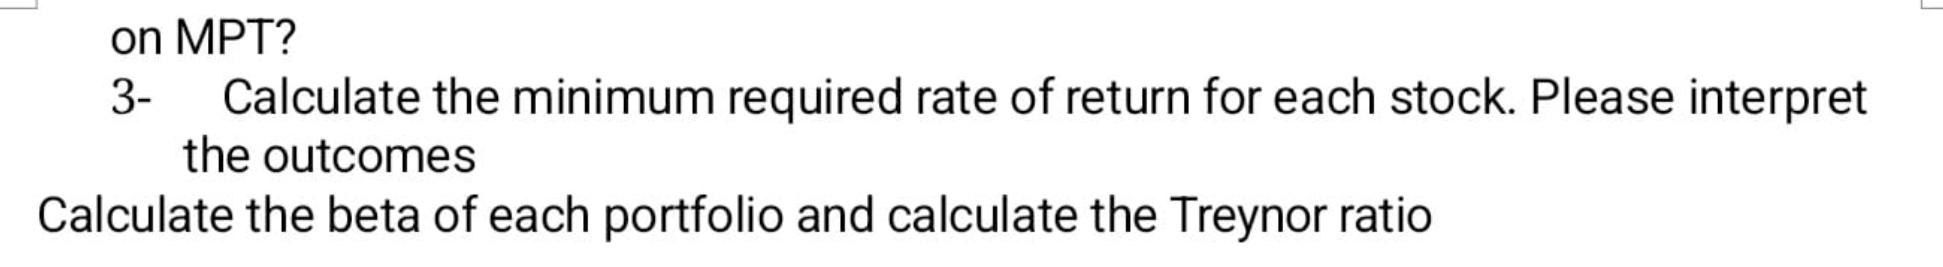
Fidelity Fund II is considering new stock selection analysis as follows: Stock A Stock B Nikkei (A,B) 6 month Tbill 1- E(R) Portfolio 1 Portfolio 2 Portfolio 3 10% 8% 8% Stock A 40% 30% 60% -0,5 3% 6 5% 12% 10% Calculate the expected Return, the Volatility and Sharp ratio for the following Hypothetic portfolios: 0,8 1,5 1 Stock B 60% 40% 10% T-bill 30% 30% 2- Please interpret the outcomes of question 1, which portfolio is the best based on MPT? 3- Calculate the minimum required rate of return for each stock. Please interpret the outcomes Calculate the beta of each portfolio and calculate the Treynor ratio
Step by Step Solution
3.38 Rating (170 Votes )
There are 3 Steps involved in it
To calculate the expected return volatility and Sharpe ratio for the hypothetical portfolios we can ... View full answer

Get step-by-step solutions from verified subject matter experts