

Question: Field data from a four - legged intersection included the following: ( 1 ) Vehicle headways starting from a standing queue: 4 . 4 ,
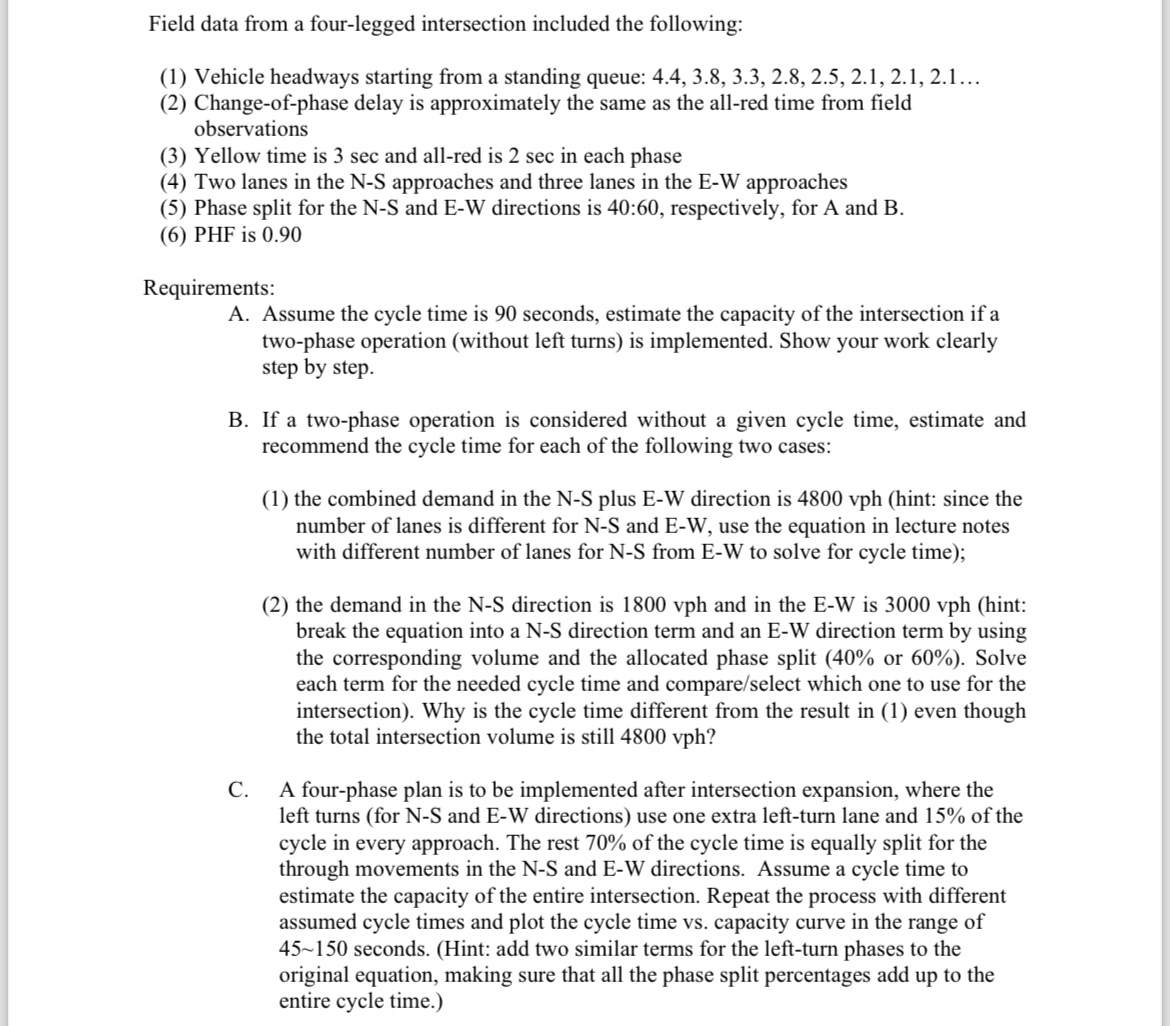
Field data from a fourlegged intersection included the following:
Vehicle headways starting from a standing queue:
Changeofphase delay is approximately the same as the allred time from field observations
Yellow time is and allred is in each phase
Two lanes in the NS approaches and three lanes in the EW approaches
Phase split for the NS and EW directions is : respectively, for A and B
is
Requirements:
A Assume the cycle time is seconds, estimate the capacity of the intersection if a twophase operation without left turns is implemented. Show your work clearly step by step.
B If a twophase operation is considered without a given cycle time, estimate and recommend the cycle time for each of the following two cases:
the combined demand in the NS plus EW direction is hint: since the number of lanes is different for NS and EW use the equation in lecture notes with different number of lanes for NS from EW to solve for cycle time;
the demand in the NS direction is and in the EW is hint: break the equation into a direction term and an direction term by using the corresponding volume and the allocated phase split or Solve each term for the needed cycle time and compareselect which one to use for the intersection Why is the cycle time different from the result in even though the total intersection volume is still
C A fourphase plan is to be implemented after intersection expansion, where the left turns for NS and EW directions use one extra leftturn lane and of the cycle in every approach. The rest of the cycle time is equally split for the through movements in the NS and EW directions. Assume a cycle time to estimate the capacity of the entire intersection. Repeat the process with different assumed cycle times and plot the cycle time vs capacity curve in the range of seconds. Hint: add two similar terms for the leftturn phases to the original equation, making sure that all the phase split percentages add up to the entire cycle time.
Step by Step Solution
There are 3 Steps involved in it
1 Expert Approved Answer
Step: 1 Unlock

Question Has Been Solved by an Expert!
Get step-by-step solutions from verified subject matter experts
Step: 2 Unlock
Step: 3 Unlock