

Question: Fifty five weeks of data have been collected on a process, as shown below. The items being produced are valued at $ 8 0 0
Fifty five weeks of data have been collected on a process, as shown below. The items being produced are valued at $ each and use $ worth of material per unit. The cost of labor is $ per hour.
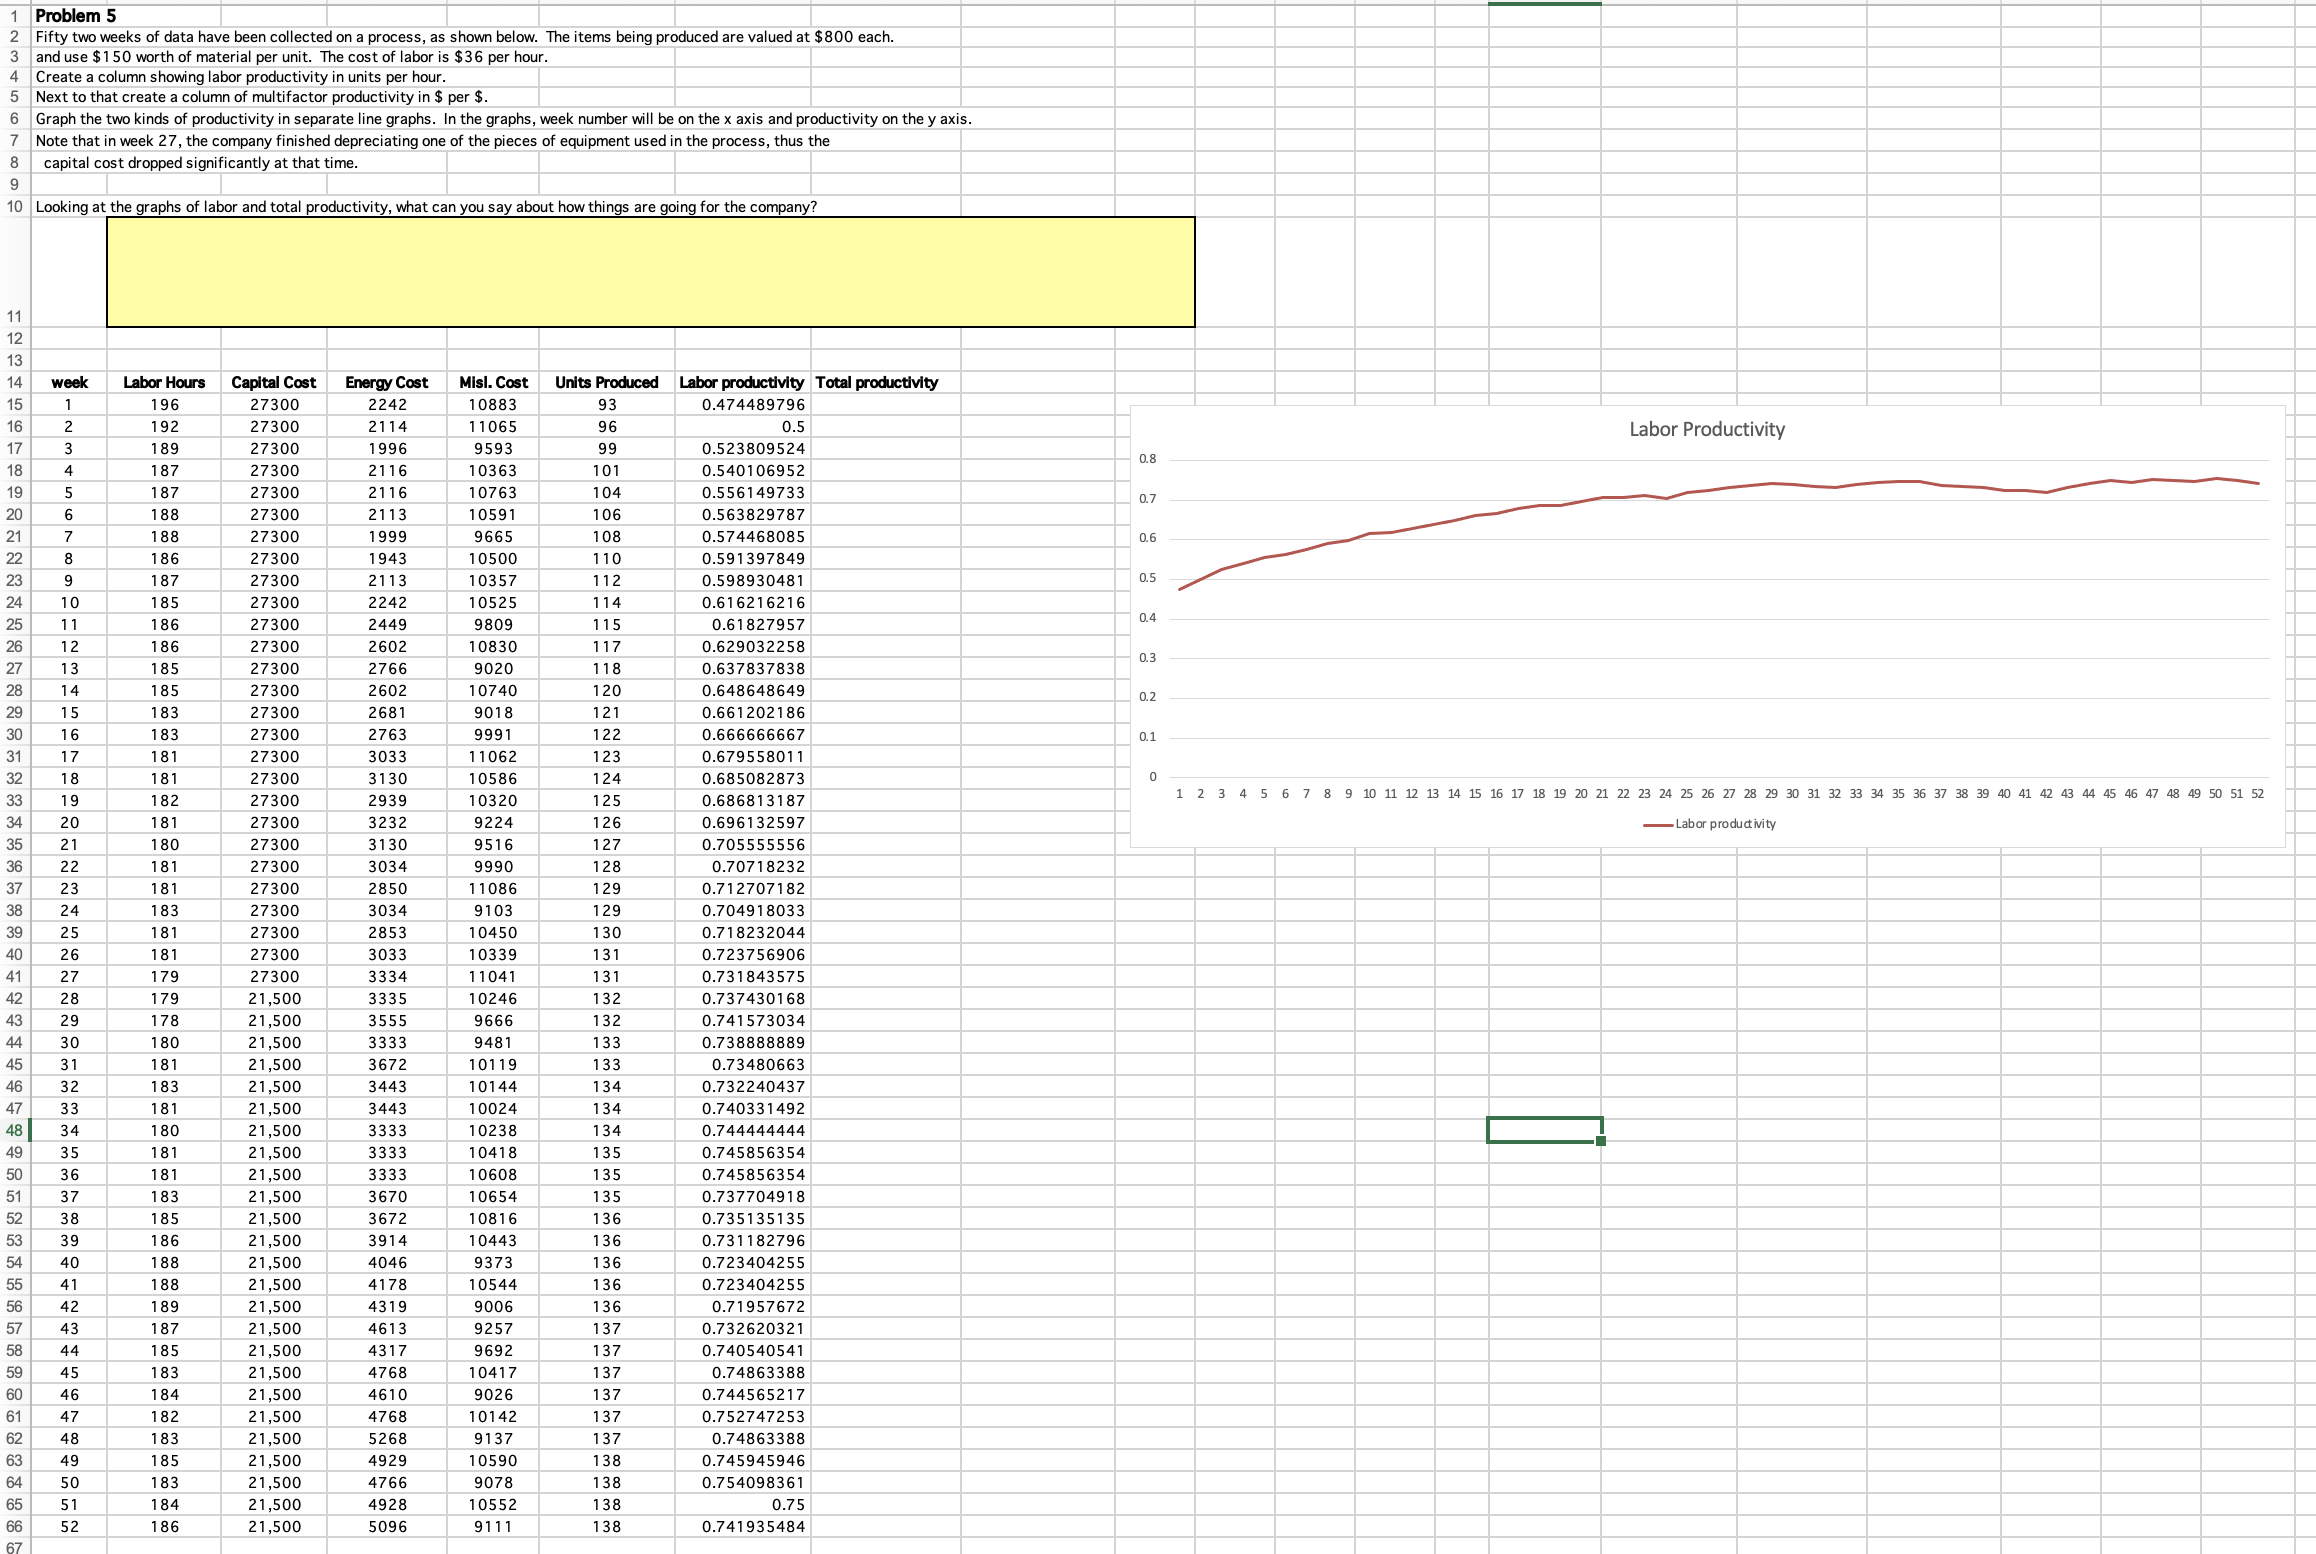
Create a column showing labor productivity in units per hour.
Next to that create a column of multifactor productivity in $ per $
Graph the two kinds of productivity in separate line graphs. In the graphs, week number will be on the x axis and productivity on the y axis.
Note that in week the company finished depreciating one of the pieces of equipment used in the process, thus the capital cost dropped significantly at that time.
Looking at the graphs of labor and total productivity, what can you say about how things are going for the company?
Step by Step Solution
There are 3 Steps involved in it
1 Expert Approved Answer
Step: 1 Unlock

Question Has Been Solved by an Expert!
Get step-by-step solutions from verified subject matter experts
Step: 2 Unlock
Step: 3 Unlock