

Question: Fig. 1 depicts an example time sequence of multiple interrupts while Table 1 lists the execution times of the user program and service routines in
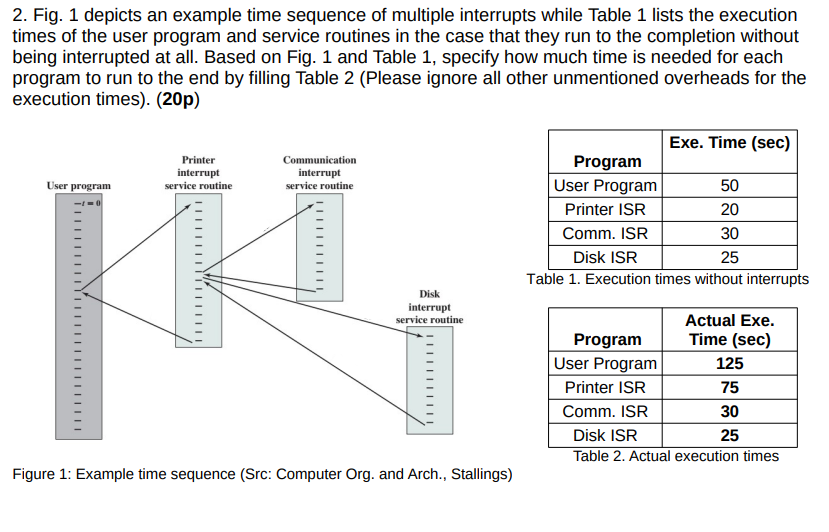
Fig. depicts an example time sequence of multiple interrupts while Table lists the execution
times of the user program and service routines in the case that they run to the completion without
being interrupted at all. Based on Fig. and Table specify how much time is needed for each
program to run to the end by filling Table Please ignore all other unmentioned overheads for the
execution timesp
Figure : Example time sequence Src: Computer Org. and Arch., Stallings
Table Execution times without interrupts
Table Actual execution times
Step by Step Solution
There are 3 Steps involved in it
1 Expert Approved Answer
Step: 1 Unlock

Question Has Been Solved by an Expert!
Get step-by-step solutions from verified subject matter experts
Step: 2 Unlock
Step: 3 Unlock