

Question: Fig. 1 shows a square wave against time in msec. If the signal passes through a low-pass filter of cut-off frequency of 70Hz, how would
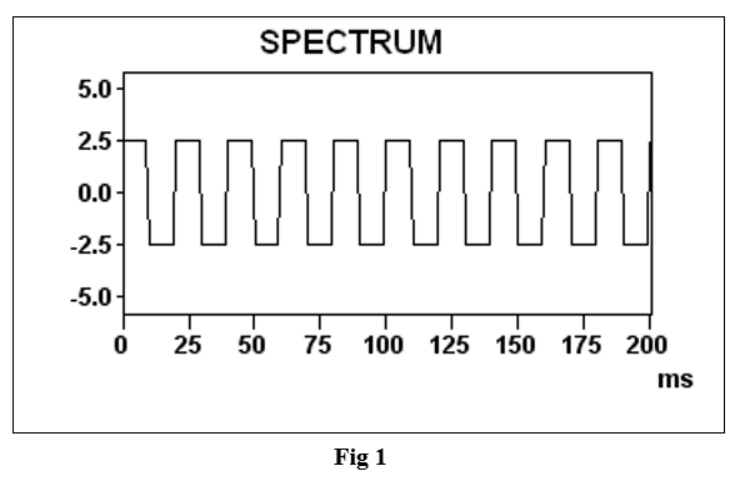
Fig. 1 shows a square wave against time in msec. If the signal passes through a low-pass filter of cut-off frequency of 70Hz, how would the signal looks like after the filter? (Answer using Fig. S1).
CoursHeroTranscribedText
5.0- 2.5 0.0- -2.5 -5.0- SPECTRUM www 0 25 50 75 100 125 150 175 200 Fig 1 ms
Step by Step Solution
There are 3 Steps involved in it
1 Expert Approved Answer
Step: 1 Unlock

Question Has Been Solved by an Expert!
Get step-by-step solutions from verified subject matter experts
Step: 2 Unlock
Step: 3 Unlock