

Question: Fig. 2 3 . 1 Consider the soil whose PSD curve is shown in the figure below. The soil has plastic limit ( P L
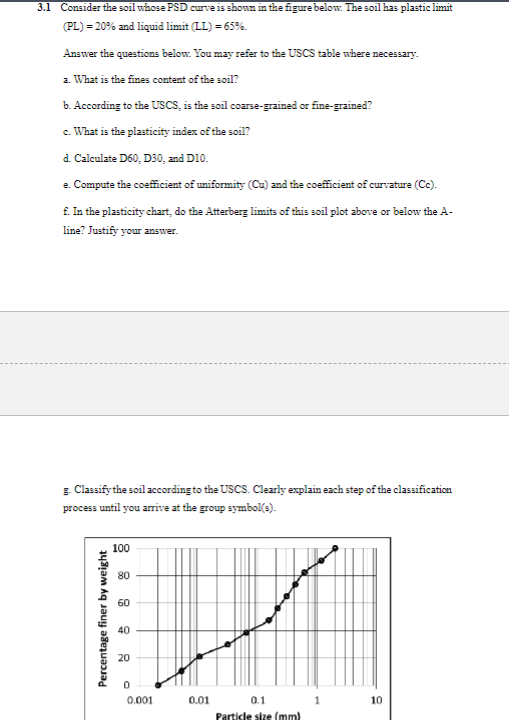
Fig. Consider the soil whose PSD curve is shown in the figure below. The soil has plastic limit
and liquid limit
Answer the questions below. You may refer to the USCS table where necessary.
a What is the fines content of the soil?
b According to the USCS, is the soil coarsegrained or finegrained?
c What is the plasticity index of the soil?
d Calculate D D and D
e Compute the coefficient of uniformity and the coefficient of curvature
f In the plasticity chart, do the Atterberg limits of this soil plot above or below the A
line? Justify your answer.
g Classify the soil according to the USCS. Clearly explain each step of the classification
process until you arrive at the group symbols
Step by Step Solution
There are 3 Steps involved in it
1 Expert Approved Answer
Step: 1 Unlock

Question Has Been Solved by an Expert!
Get step-by-step solutions from verified subject matter experts
Step: 2 Unlock
Step: 3 Unlock