

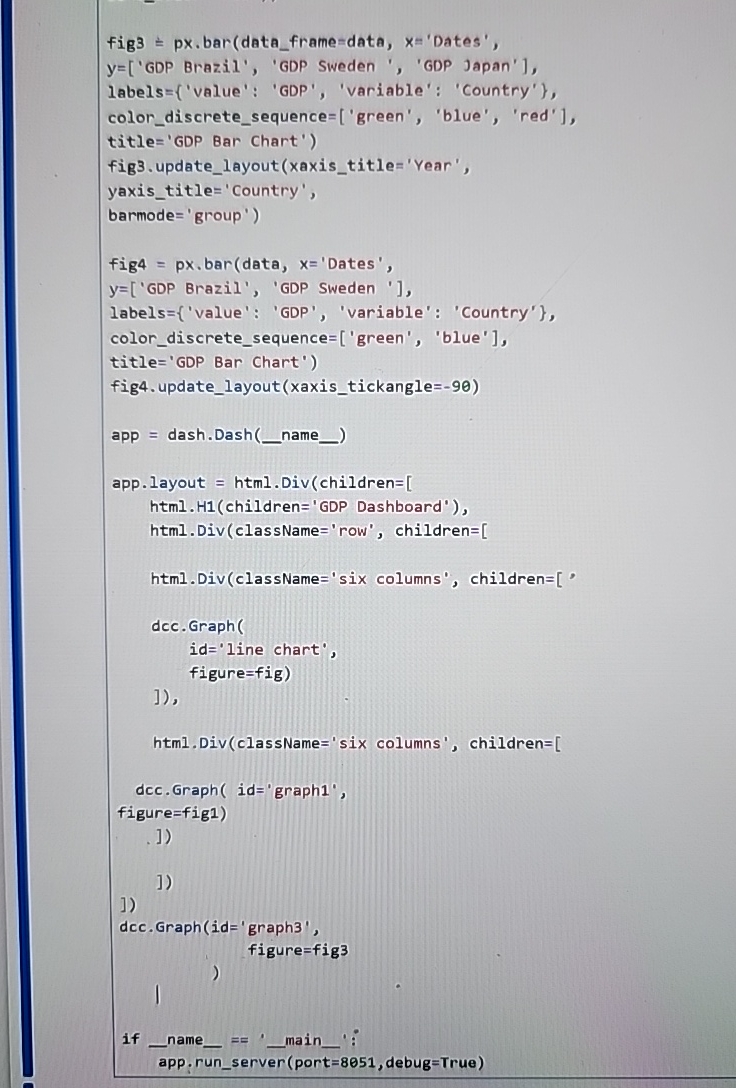
Question: fig 3 px bar ( data _ frame - data, x = 'Dates',y = [ ' GDP Brazil', ' GDP Sweden', ' GDP Japan'l,labels =
fig px bar dataframedata, x'Dates',yGDP Brazil', GDP Sweden', GDP Japan'l,labelsvalue: GDP 'variable' : 'Country'colordiscretesequencegreen 'blue', 'red'titleGDP Bar Chart'figupdatelayout xaxistitle 'Year',yaxistitle'Country'barmode'group'fig pxbardata x'Dates'yGDP Brazil', GDP Sweden labelsvalue: GDP 'variable': 'Country'colordiscretesequencegreen 'blue'title GDP Bar Chart'figupdate layout xaxistickangleapp dash.Dash nameapplayout html DivchildrenhtmlHchildrenGDP Dashboard' htmlDivclassName'row', childrenhtmlDivclassName'six columns' childrendccGraphidine chart',html DivclassName'six columns', childrenfigurefigdccGraph id'graphfigurefigdccGraphid'graph namefigurefigmainapp.runserven portO debugTrue
figure is not showing up on dashboard
Step by Step Solution
There are 3 Steps involved in it
1 Expert Approved Answer
Step: 1 Unlock

Question Has Been Solved by an Expert!
Get step-by-step solutions from verified subject matter experts
Step: 2 Unlock
Step: 3 Unlock