

Question: FIG 4.7 IS SHOWN BELOW: E. For n2 and 1 s Ts 30 (where Tis the number of postings), perform a step-by-step simulation of the
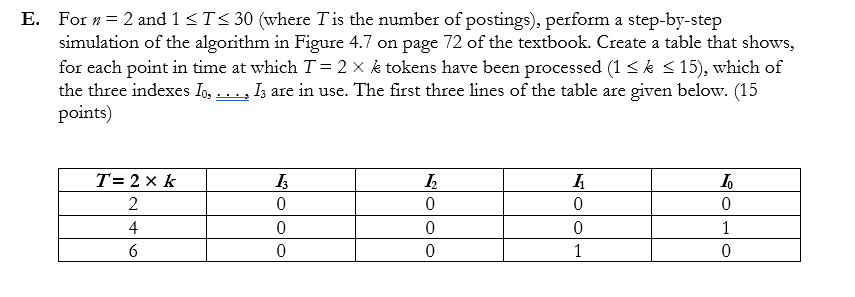
FIG 4.7 IS SHOWN BELOW:
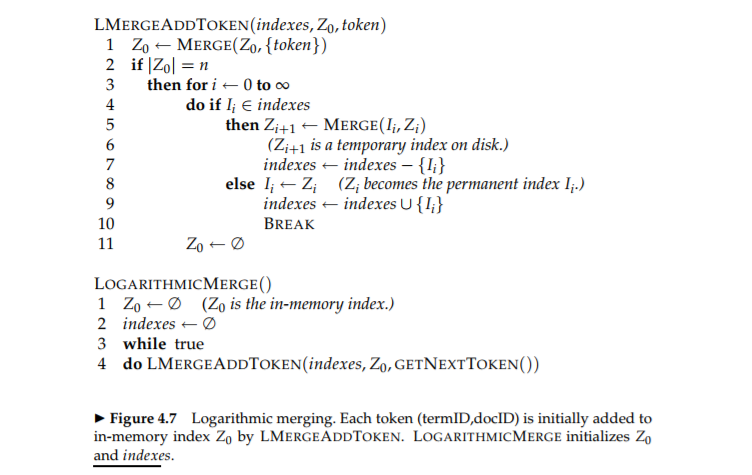
E. For n2 and 1 s Ts 30 (where Tis the number of postings), perform a step-by-step simulation of the algorithm in Figure 4.7 on page 72 of the textbook. Create a table that shows, for each point in time at which T-2 k tokens have been processed (1 k 15), which of the three indexes0s-,.3 are in use. The first three lines of the table are given below. (15 points 4 0 0 E. For n2 and 1 s Ts 30 (where Tis the number of postings), perform a step-by-step simulation of the algorithm in Figure 4.7 on page 72 of the textbook. Create a table that shows, for each point in time at which T-2 k tokens have been processed (1 k 15), which of the three indexes0s-,.3 are in use. The first three lines of the table are given below. (15 points 4 0 0
Step by Step Solution
There are 3 Steps involved in it

Get step-by-step solutions from verified subject matter experts