

Question: Figure 1 2 . 1 Excel WOr In this section, we show how to construct a simulation model and conduct a risk analysis using native
Figure
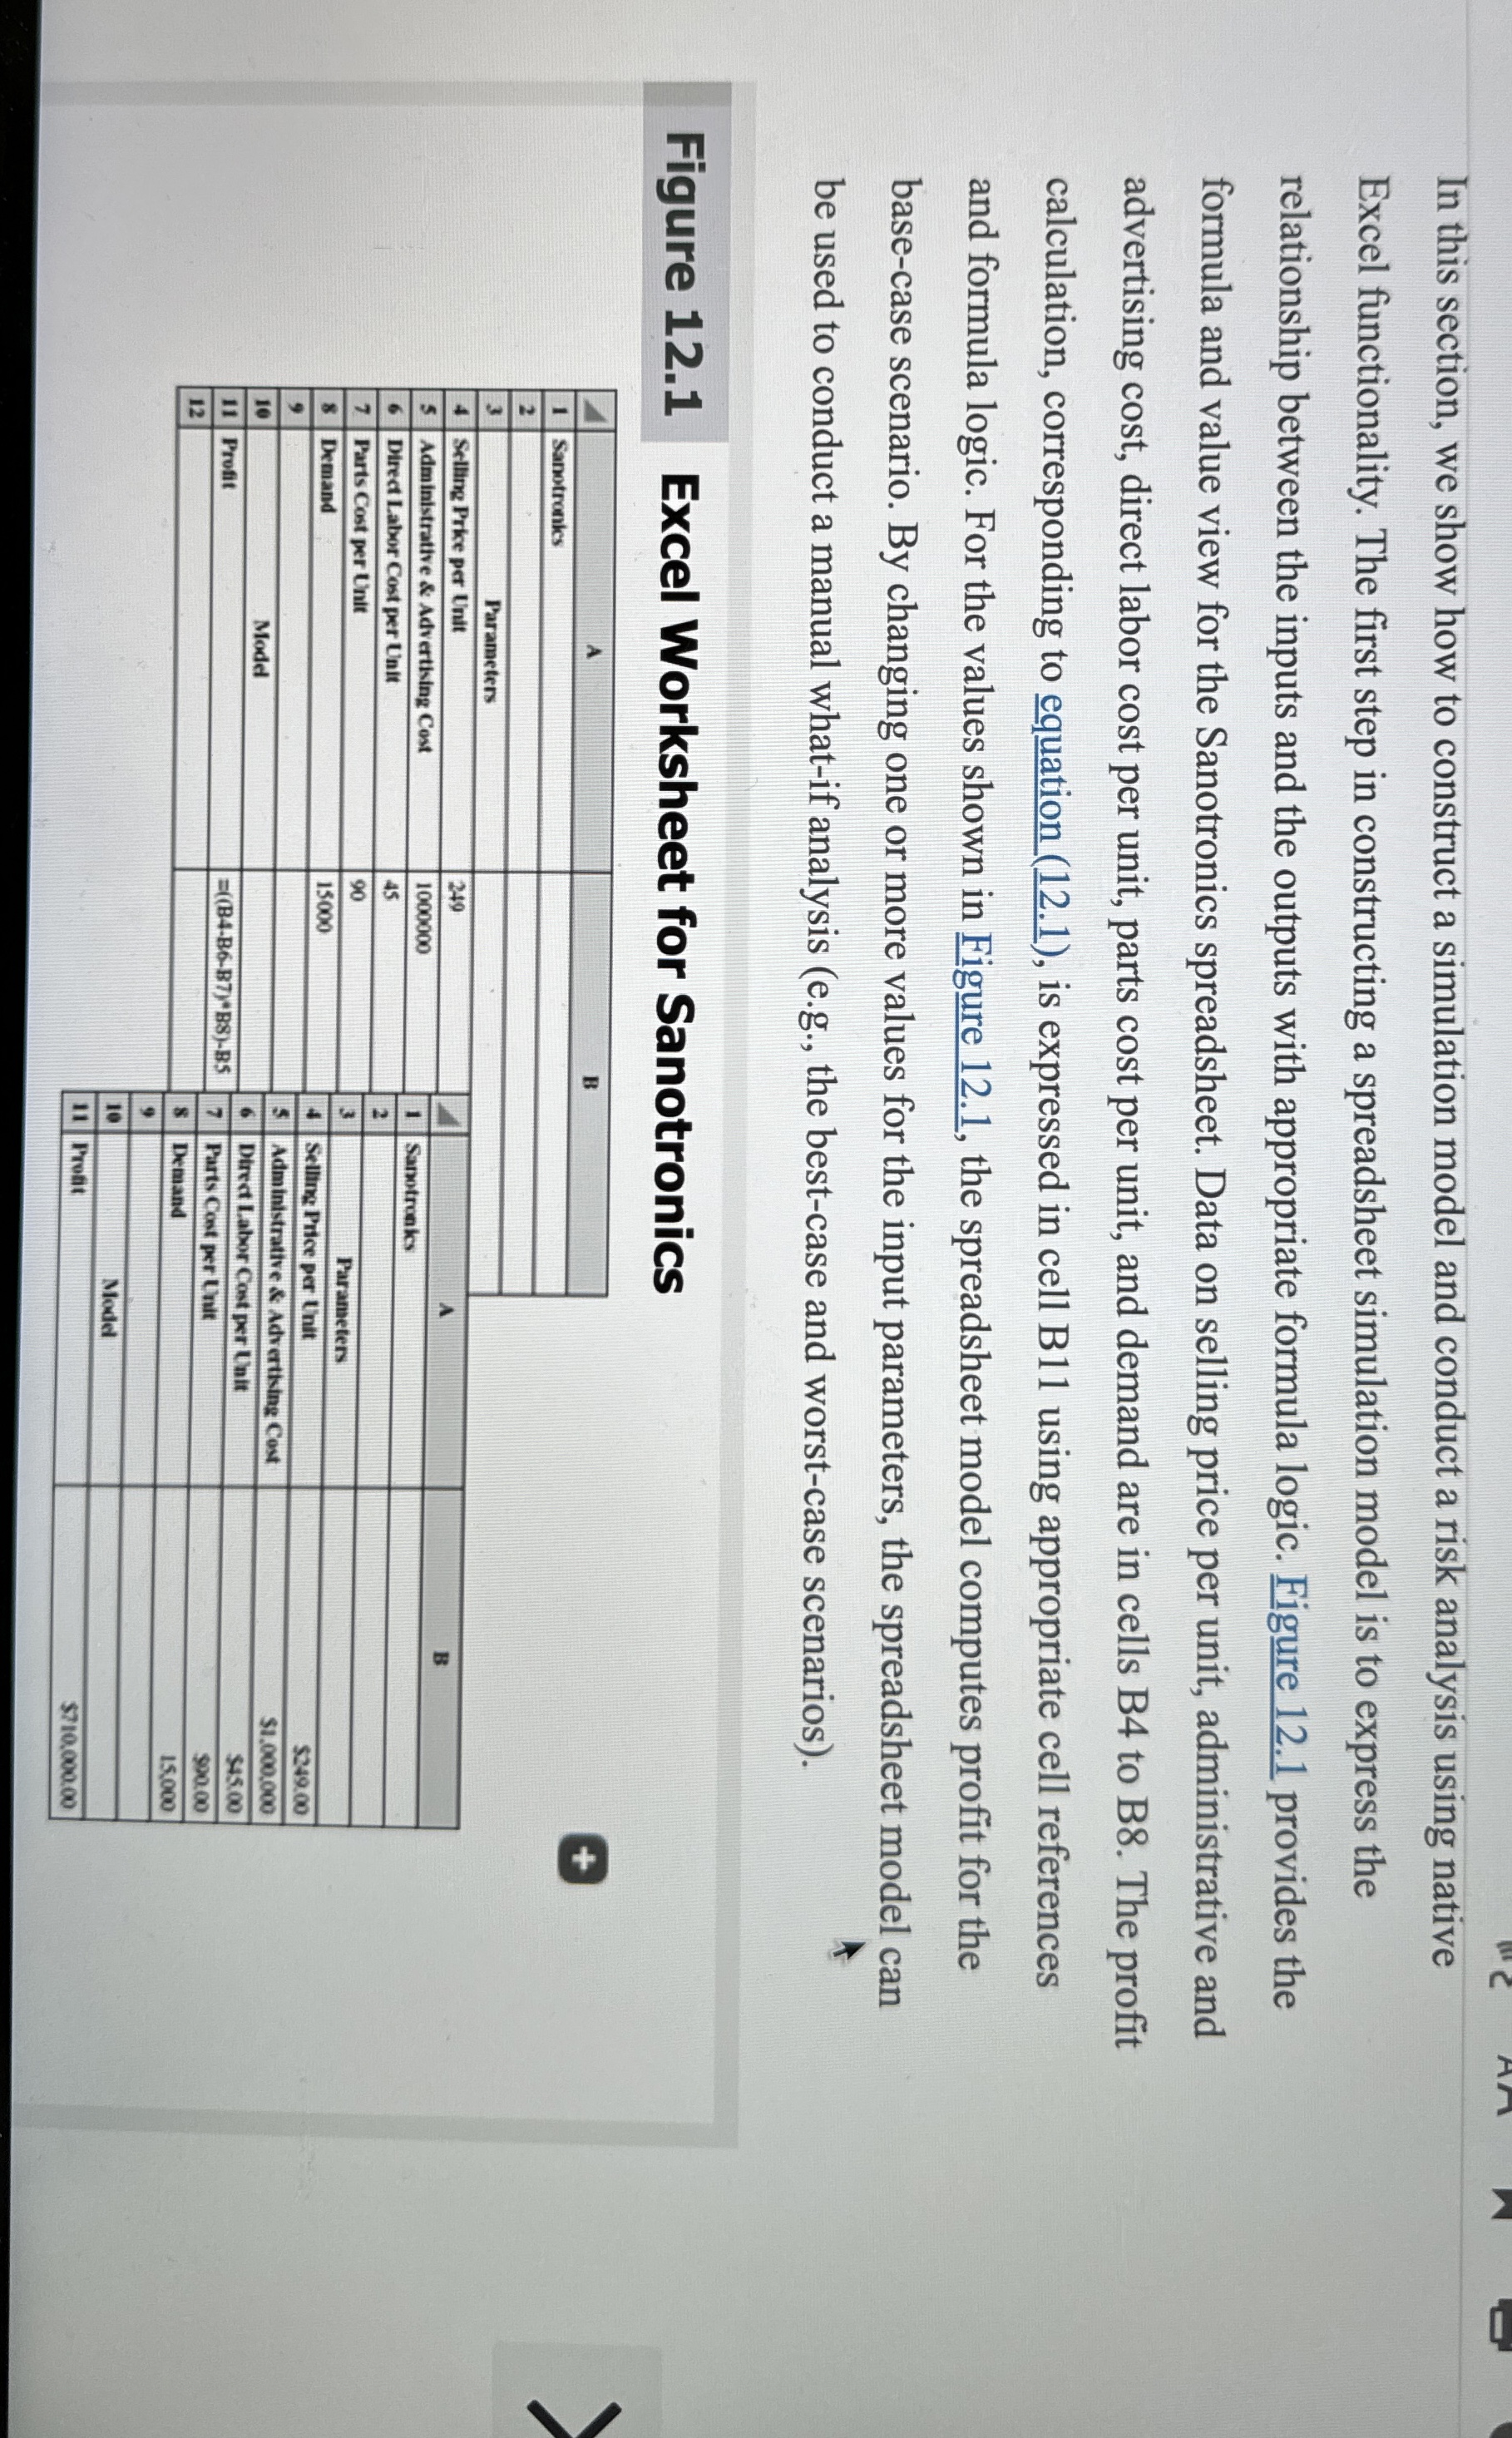
Excel WOr
In this section, we show how to construct a simulation model and conduct a risk analysis using native Excel functionality. The first step in constructing a spreadsheet simulation model is to express the relationship between the inputs and the outputs with appropriate formula logic. Figure provides the formula and value view for the Sanotronics spreadsheet. Data on selling price per unit, administrative and advertising cost, direct labor cost per unit, parts cost per unit, and demand are in cells B to B The profit calculation, corresponding to equation is expressed in cell B using appropriate cell references and formula logic. For the values shown in Figure the spreadsheet model computes profit for the basecase scenario. By changing one or more values for the input parameters, the spreadsheet model can be used to conduct a manual whatif analysis eg the bestcase and worstcase scenarios
Figure Excel Worksheet for Sanotronics
tableABSanotronics,,,,Parameters,,,,Selling Prike per Unit,AAdministrative & Advertising Cost,Samotrintor BDirect Labor Cost per Unit,Sanotrunics,Parts Cost per Unit,Demand,Parameters,Selling Price per Unit,$sheet for Sanotronics
Of the parameters, the company is not certain about of the parameters. What are the parameters and what is the best Value for each parameter? What is the worst case value for each of these parameters? What is the best case value for each of the parameters.
Ch
Step by Step Solution
There are 3 Steps involved in it
1 Expert Approved Answer
Step: 1 Unlock

Question Has Been Solved by an Expert!
Get step-by-step solutions from verified subject matter experts
Step: 2 Unlock
Step: 3 Unlock