

Question: Figure 1 . Batch settling data for Question 2 ( a ) . ( b ) The data in Table were obtained from a batch
Figure Batch settling data for Question a
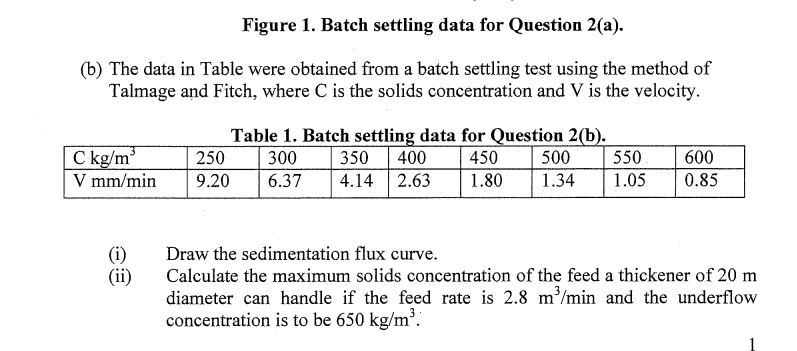
b The data in Table were obtained from a batch settling test using the method of
Talmage and Fitch, where is the solids concentration and is the velocity.
Table Batch settling data for Question b
i Draw the sedimentation flux curve.
ii Calculate the maximum solids concentration of the feed a thickener of
diameter can handle if the feed rate is and the underflow
concentration is to be
Step by Step Solution
There are 3 Steps involved in it
1 Expert Approved Answer
Step: 1 Unlock

Question Has Been Solved by an Expert!
Get step-by-step solutions from verified subject matter experts
Step: 2 Unlock
Step: 3 Unlock