

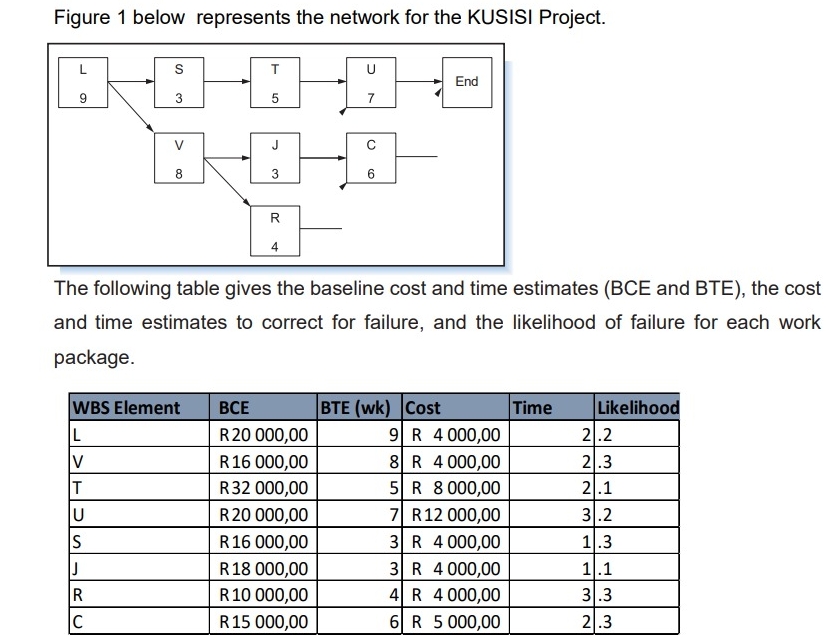
Question: Figure 1 below represents the network for the KUSISI Project. The following table gives the baseline cost and time estimates ( BCE and BTE )
Figure below represents the network for the KUSISI Project.
The following table gives the baseline cost and time estimates BCE and BTE the cost and time estimates to correct for failure, and the likelihood of failure for each work package.
tableWBS Element,BCE,BTE wkCost,Time,LikelihoodLRR VRR TRR URRSRR JRR RRR CRR
Determine the risk time and risk cost for all the WBS elements of the project.
Which activities pose the highest risks and why?
What is the project expected cost EC and expected time ET for the project?
Step by Step Solution
There are 3 Steps involved in it
1 Expert Approved Answer
Step: 1 Unlock

Question Has Been Solved by an Expert!
Get step-by-step solutions from verified subject matter experts
Step: 2 Unlock
Step: 3 Unlock