

Question: Figure 1 does not suggest that most injuries occur when the waves are high. This does not mean it is safer to swim when waves
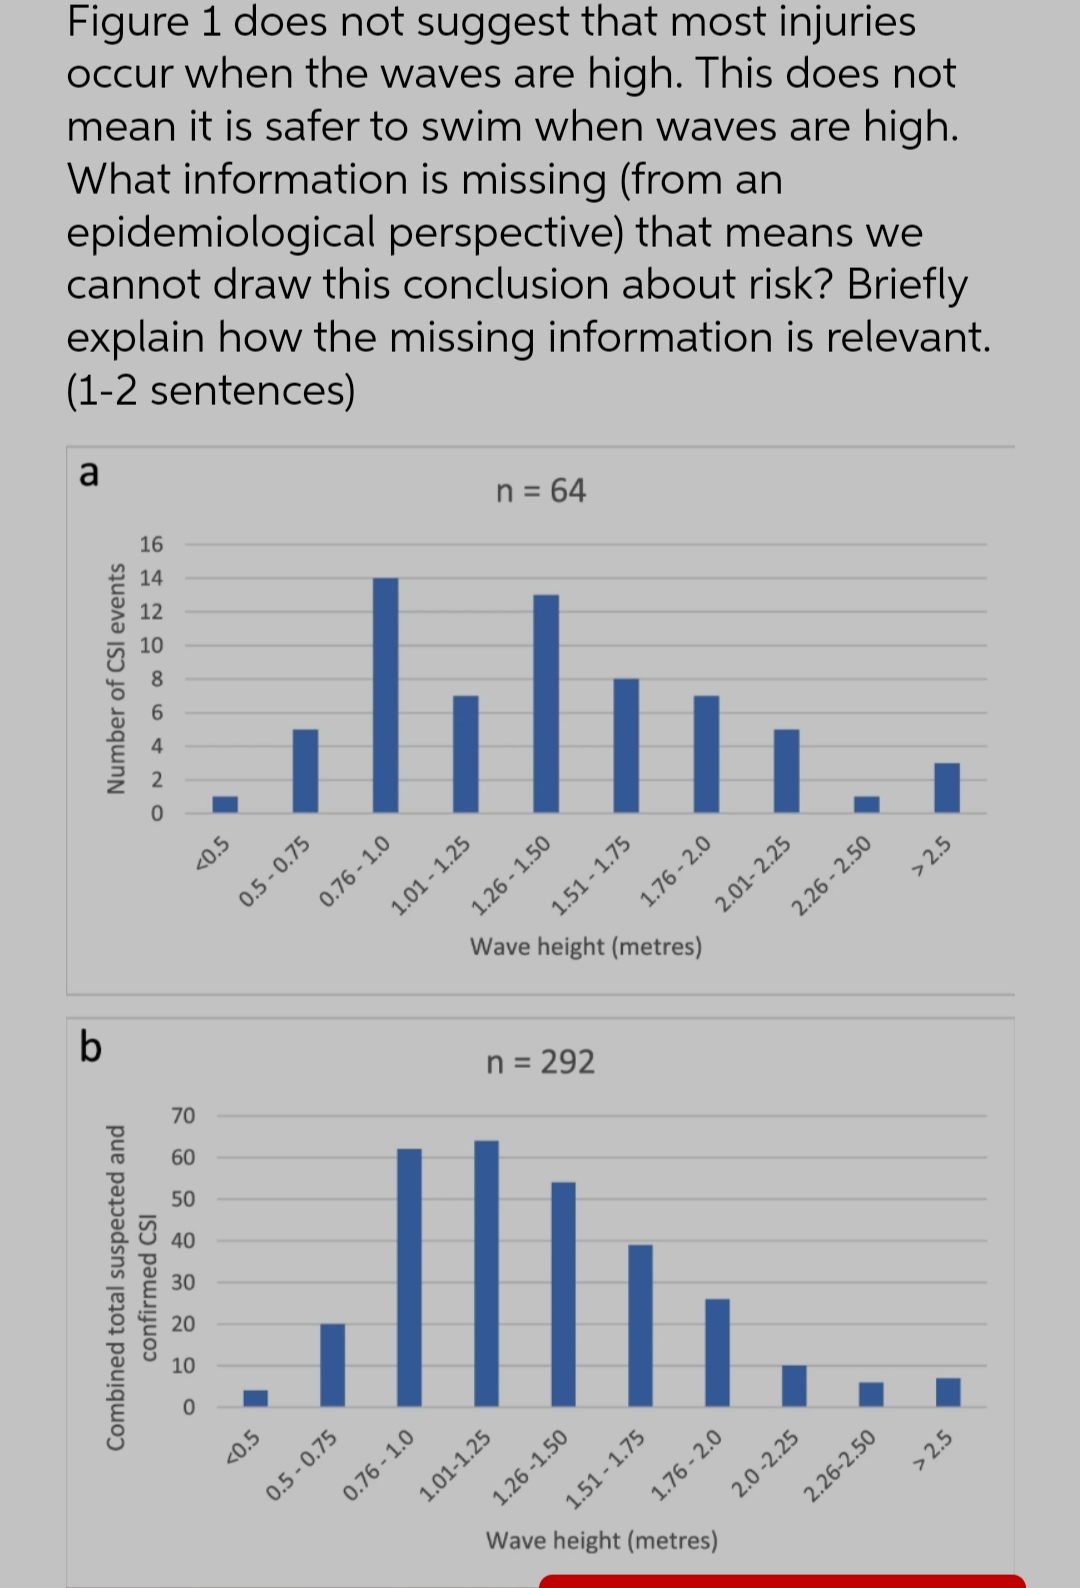

Figure 1 does not suggest that most injuries occur when the waves are high. This does not mean it is safer to swim when waves are high. What information is missing (from an epidemiological perspective) that means we cannot draw this conclusion about risk? Briefly explain how the missing information is relevant. (1-2 sentences) a n = 64 16 Number of CSI events ONAMOOND 20.5 0.5 - 0.75 0.76 - 1.0 1.50 1.01 - 1.25 1.26 - 1.51 - 1.75 1.76 - 2.0 - 2.25 16 - 2.50 > 2.5 2. Wave height (metres) b n = 292 Combined total suspected and confirmed CSI 2.5 1.26 1.51 - 1.75 1.76 - 2.0 2.0 -2.2 2.26-2.50 Wave height (metres)
Step by Step Solution
There are 3 Steps involved in it
1 Expert Approved Answer
Step: 1 Unlock

Question Has Been Solved by an Expert!
Get step-by-step solutions from verified subject matter experts
Step: 2 Unlock
Step: 3 Unlock