

Question: Figure 1 Hydrograph determined from flow measurements on a spring ( 3 0 points ) The volumetric discharge of a river at the start of
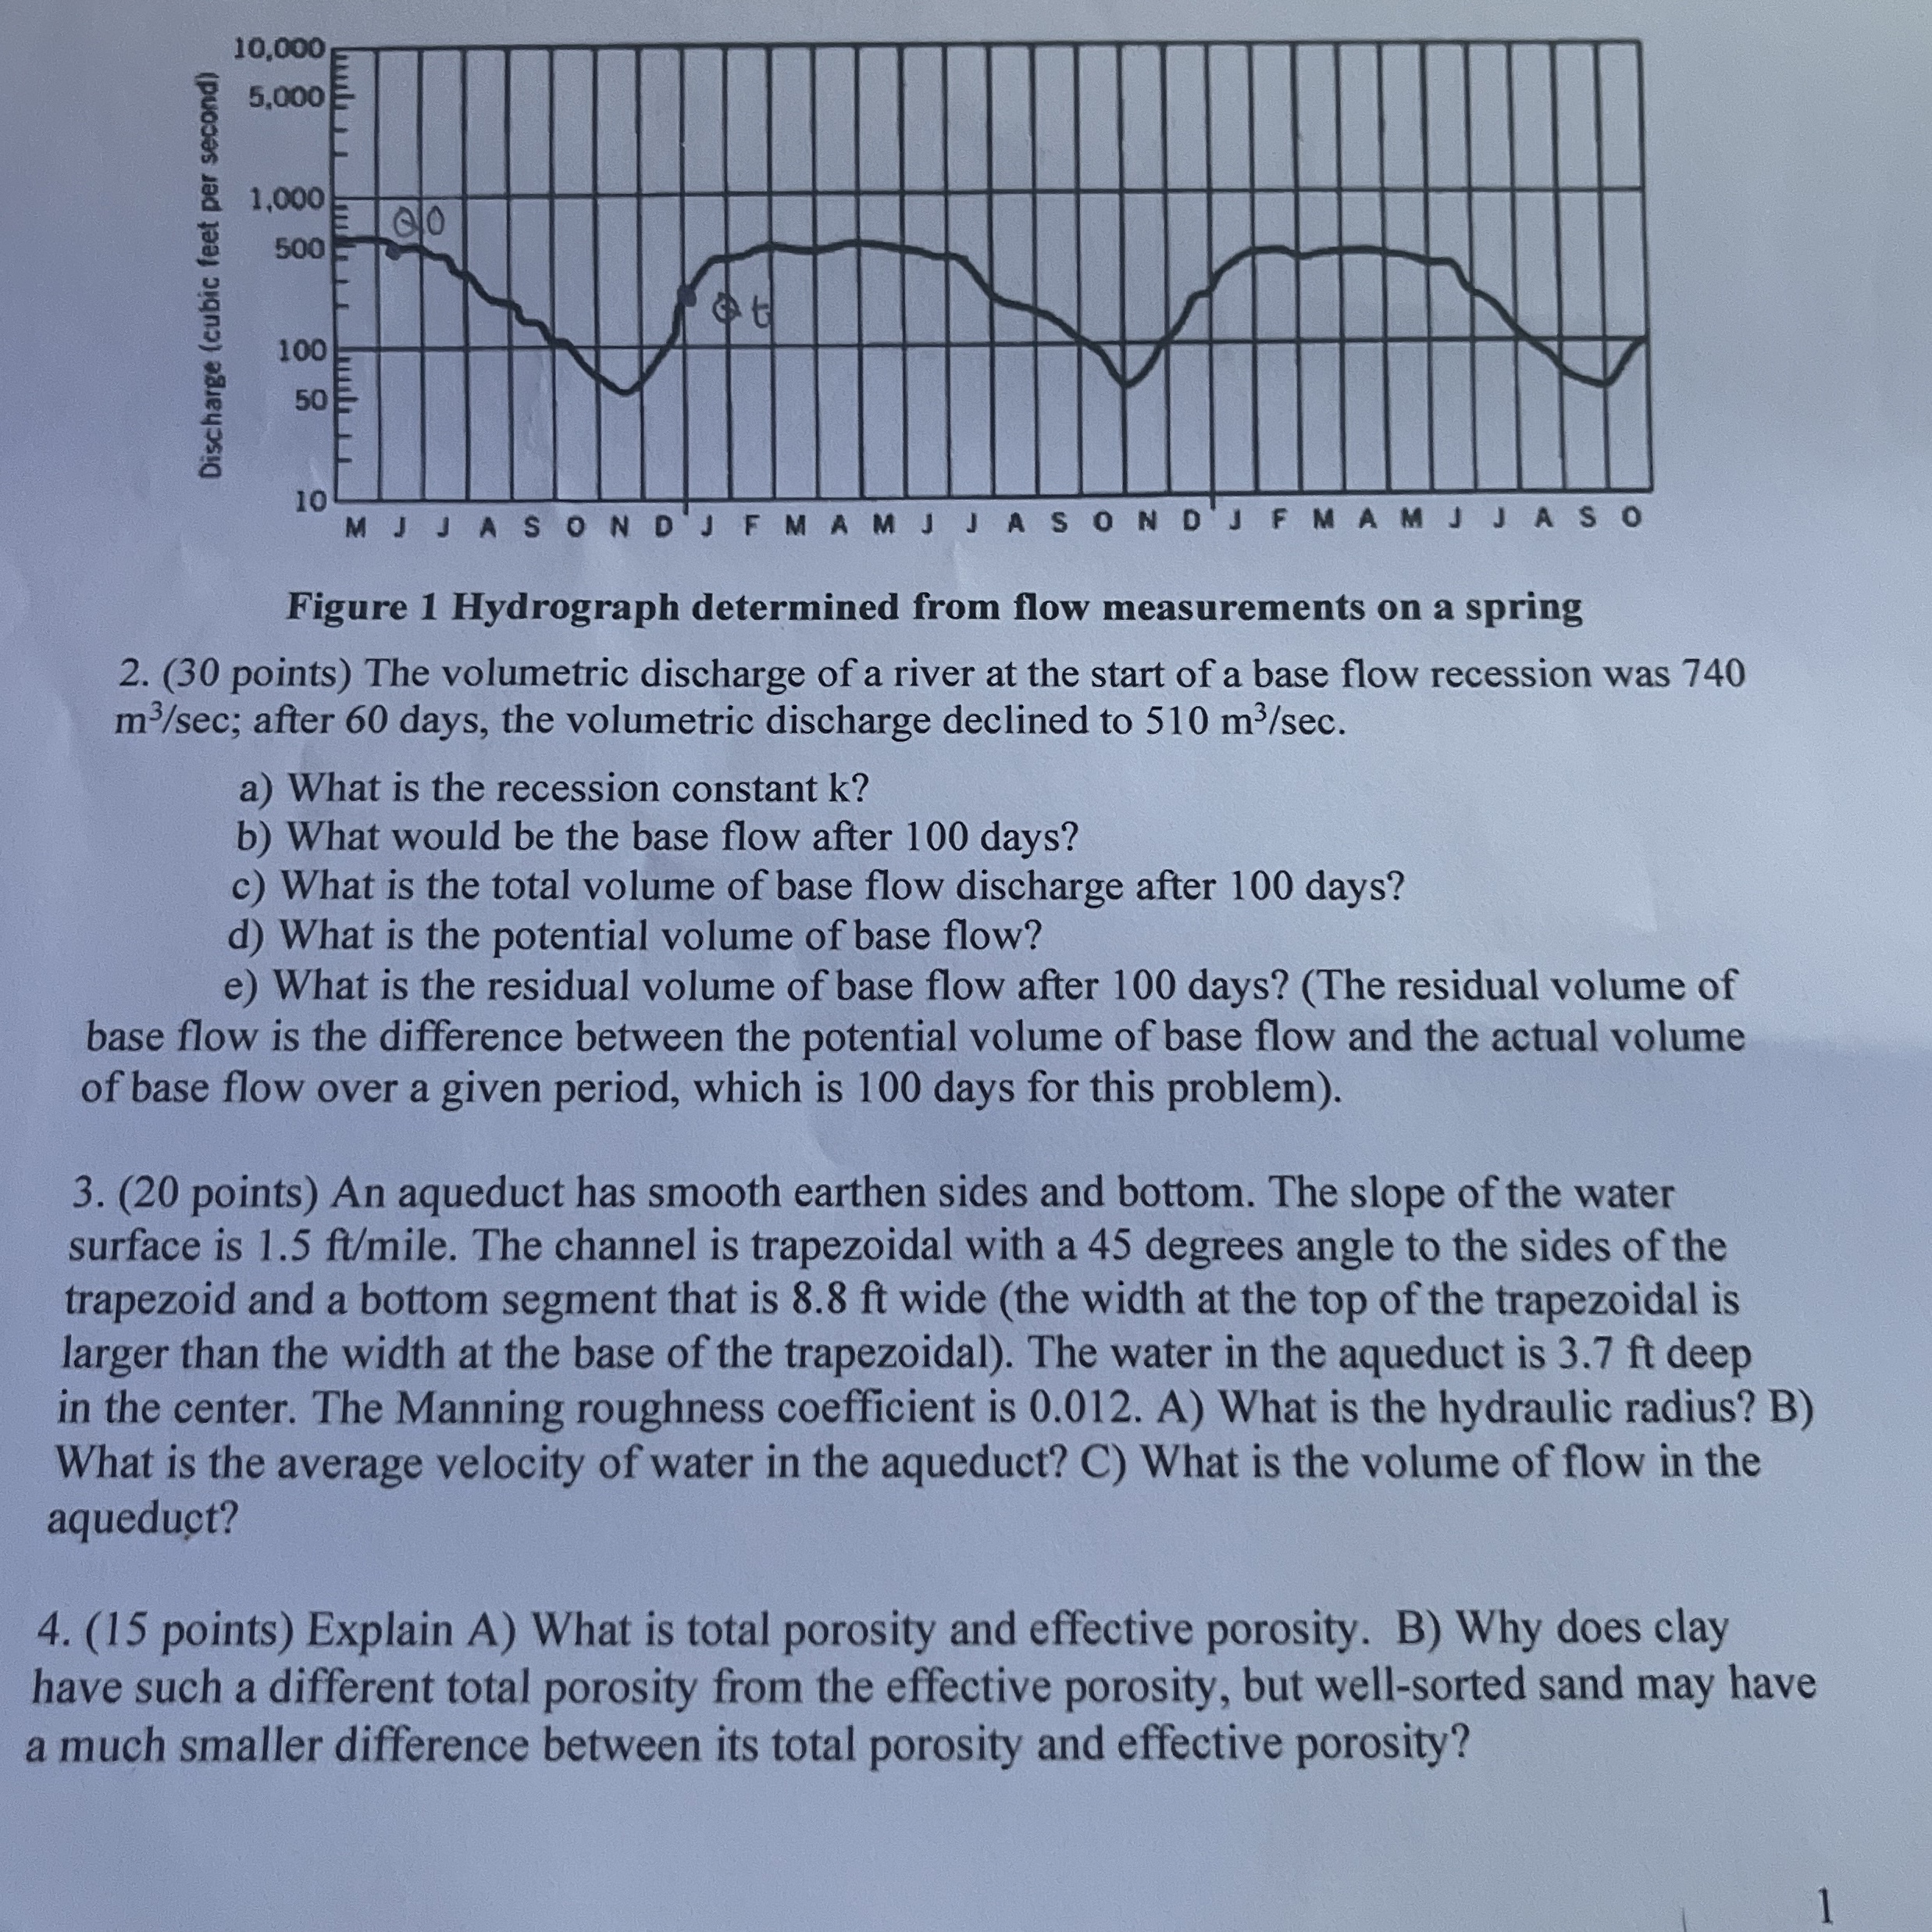
Figure Hydrograph determined from flow measurements on a spring
points The volumetric discharge of a river at the start of a base flow recession was
; after days, the volumetric discharge declined to
a What is the recession constant k
b What would be the base flow after days?
c What is the total volume of base flow discharge after days?
d What is the potential volume of base flow?
e What is the residual volume of base flow after days? The residual volume of
base flow is the difference between the potential volume of base flow and the actual volume
of base flow over a given period, which is days for this problem
points An aqueduct has smooth earthen sides and bottom. The slope of the water
surface is ile. The channel is trapezoidal with a degrees angle to the sides of the
trapezoid and a bottom segment that is ft wide the width at the top of the trapezoidal is
larger than the width at the base of the trapezoidal The water in the aqueduct is ft deep
in the center. The Manning roughness coefficient is A What is the hydraulic radius? B
What is the average velocity of water in the aqueduct? C What is the volume of flow in the
aqueduct?
points Explain A What is total porosity and effective porosity. B Why does clay
have such a different total porosity from the effective porosity, but wellsorted sand may have
a much smaller difference between its total porosity and effective porosity?
Step by Step Solution
There are 3 Steps involved in it
1 Expert Approved Answer
Step: 1 Unlock

Question Has Been Solved by an Expert!
Get step-by-step solutions from verified subject matter experts
Step: 2 Unlock
Step: 3 Unlock