

Question: Figure 1 is a ( P V ) diagram of an isobaric process, illustrating how an amount of neon gas contracts inside a
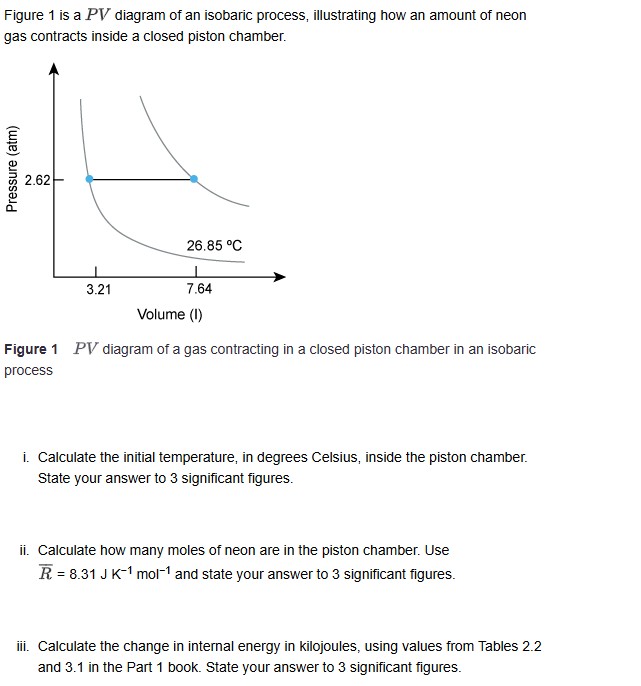
Figure is a P V diagram of an isobaric process, illustrating how an amount of neon gas contracts inside a closed piston chamber.
Figure P V diagram of a gas contracting in a closed piston chamber in an isobaric process
i Calculate the initial temperature, in degrees Celsius, inside the piston chamber. State your answer to significant figures.
ii Calculate how many moles of neon are in the piston chamber. Use barRmathrm~Jmathrm~Kmathrm~mol and state your answer to significant figures.
iii. Calculate the change in internal energy in kilojoules, using values from Tables and in the Part book. State your answer to significant figures.
Step by Step Solution
There are 3 Steps involved in it
1 Expert Approved Answer
Step: 1 Unlock

Question Has Been Solved by an Expert!
Get step-by-step solutions from verified subject matter experts
Step: 2 Unlock
Step: 3 Unlock