

Question: Figure 1: Quantity Demanded Quantity Supplied 10 50 20 40 30 30 40 20 50 10 11. Refer to Figure 1. The market equilibrium is
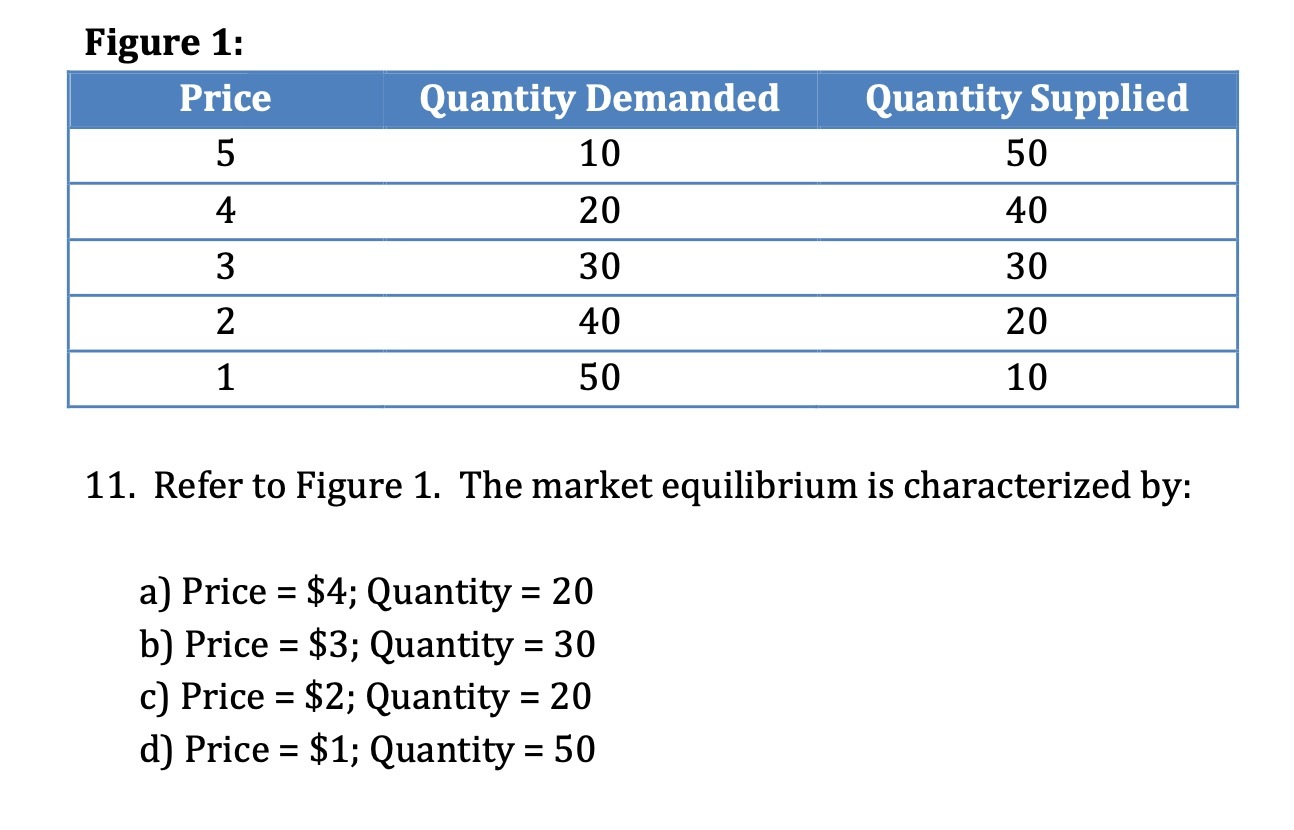

Figure 1: Quantity Demanded Quantity Supplied 10 50 20 40 30 30 40 20 50 10 11. Refer to Figure 1. The market equilibrium is characterized by: a) Price = $4; Quantity = 20 b] Price = $3; Quantity = 30 c] Price = $2 ; Quantity = 20 d) Price = $1; Quantity = 50
Step by Step Solution
There are 3 Steps involved in it
1 Expert Approved Answer
Step: 1 Unlock

Question Has Been Solved by an Expert!
Get step-by-step solutions from verified subject matter experts
Step: 2 Unlock
Step: 3 Unlock