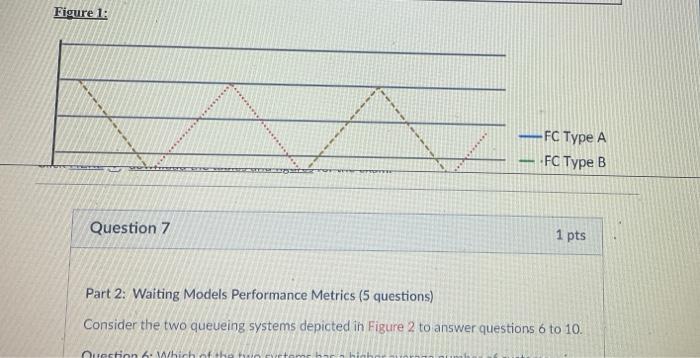
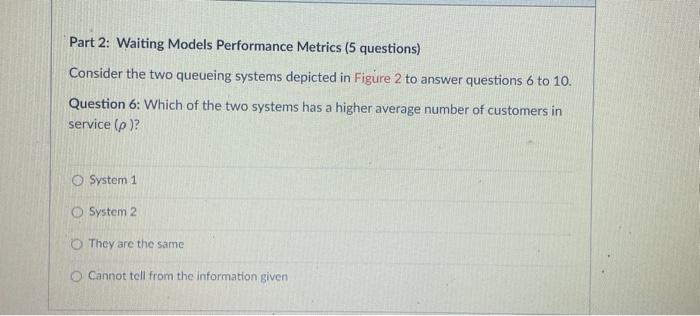
Question: Figure 1: Question 7 1 pts Part 2: Waiting Models Performance Metrics ( 5 questions) Consider the two queueing systems depicted in Figure 2 to

Figure 1: Question 7 1 pts Part 2: Waiting Models
Figure 1: Question 7 1 pts Part 2: Waiting Models Performance Metrics ( 5 questions) Consider the two queueing systems depicted in Figure 2 to answer questions 6 to 10. Part 2: Waiting Models Performance Metrics (5 questions) Consider the two queueing systems depicted in Figure 2 to answer questions 6 to 10. Question 6: Which of the two systems has a higher average number of customers in service ()? System 1 System 2 They are the same Cannot tell from the information given Figure 1: Question 7 1 pts Part 2: Waiting Models Performance Metrics ( 5 questions) Consider the two queueing systems depicted in Figure 2 to answer questions 6 to 10. Part 2: Waiting Models Performance Metrics (5 questions) Consider the two queueing systems depicted in Figure 2 to answer questions 6 to 10. Question 6: Which of the two systems has a higher average number of customers in service ()? System 1 System 2 They are the same Cannot tell from the information given

Step by Step Solution

There are 3 Steps involved in it

1 Expert Approved Answer
Step: 1 Unlock blur-text-image
Question Has Been Solved by an Expert!

Get step-by-step solutions from verified subject matter experts

Step: 2 Unlock
Step: 3 Unlock

Students Have Also Explored These Related General Management Questions!