

Question: Figure ( 1 ) shows a weir section, constructed on a clayey sand layer where the coefficient of permeability is ( 1 . 5
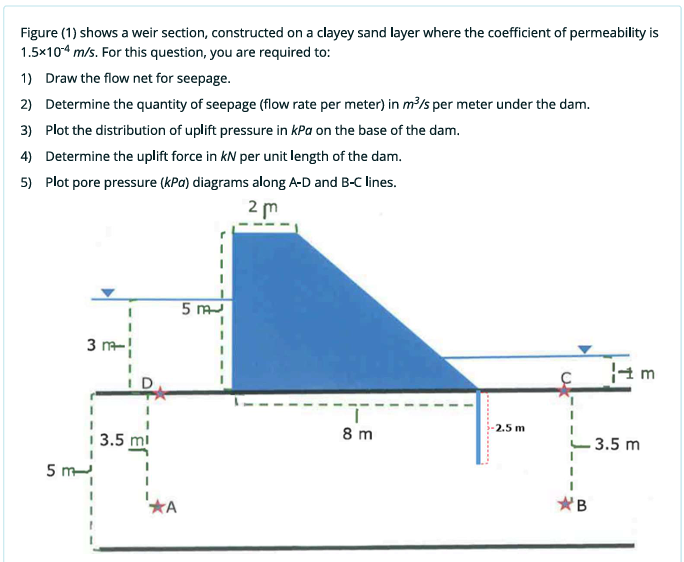
Figure shows a weir section, constructed on a clayey sand layer where the coefficient of permeability is times mathrm~mmathrms For this question, you are required to:
Draw the flow net for seepage.
Determine the quantity of seepage flow rate per meter in mathrmmmathrms per meter under the dam.
Plot the distribution of uplift pressure in k P a on the base of the dam.
Determine the uplift force in k N per unit length of the dam.
Plot pore pressure kPa diagrams along AD and BC lines. Flow net and quality of flow net
Calculation of head difference
Quantity of flow rate
Uplift pressure relevant calculation
Uplift pressure plot
Uplift force per unit length of dam calculation
Pore pressure diagram relevant calculation
Pore pressure diagram DA
Pore pressure diagram BC
Step by Step Solution
There are 3 Steps involved in it
1 Expert Approved Answer
Step: 1 Unlock

Question Has Been Solved by an Expert!
Get step-by-step solutions from verified subject matter experts
Step: 2 Unlock
Step: 3 Unlock