

Question: Figure 1 shows the probability densities of second continuous random variables X and Y in the range 0 ? x ? a Random variable X
Figure 1 shows the probability densities of second continuous random variables X and Y in the range0?x?a
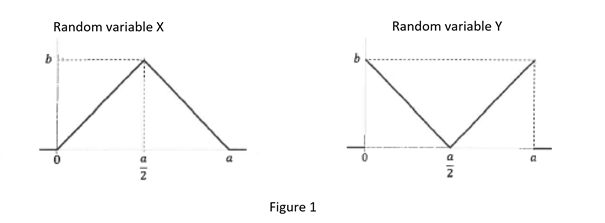
Random variable X Random variable Y h NA - NIB Figure 1
Step by Step Solution
There are 3 Steps involved in it
1 Expert Approved Answer
Step: 1 Unlock

Question Has Been Solved by an Expert!
Get step-by-step solutions from verified subject matter experts
Step: 2 Unlock
Step: 3 Unlock