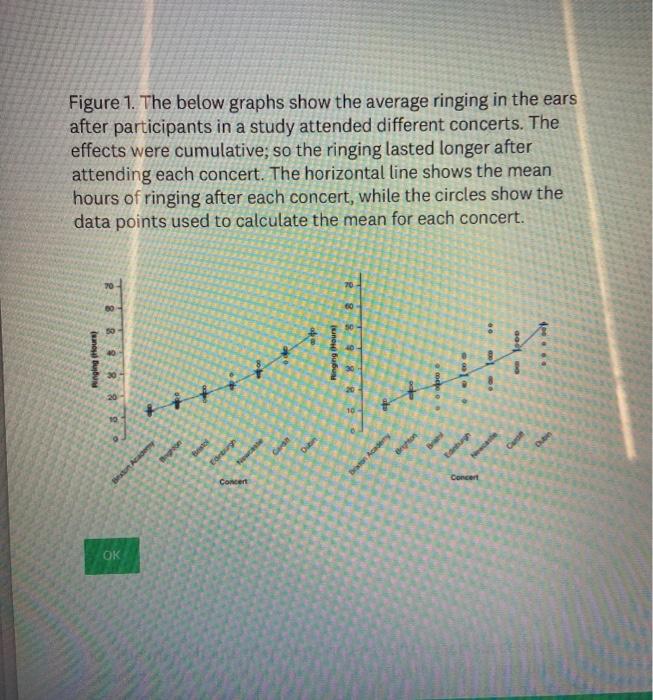
Question: Figure 1. The below graphs show the average ringing in the ears after participants in a study attended different concerts. The effects were cumulative; so

Figure 1. The below graphs show the average
Figure 1. The below graphs show the average ringing in the ears after participants in a study attended different concerts. The effects were cumulative; so the ringing lasted longer after attending each concert. The horizontal line shows the mean hours of ringing after each concert, while the circles show the data points used to calculate the mean for each concert. TO 50 peo 4. und Butun 8 8 8 Ringing tours Hitit 10. Don Academy Concert Concert OK 10. The mean hours of ringing increase after each successive concert a participant attends is shown by the blue trend line. Focusing on the means and the distribution of scores around the mean for each concert, which of the following are TRUE about the graph on the RIGHT. (select all that apply) The hours of ringing in the ears had a similar distribution after each concert. The deviations from the mean of each concert are homoskedastic. The sample of study participants attending each concert is small. The hours of ringing in the ears increases on average after each successive concert a participant attends. The deviations from the mean of each concert show heterogeneity of variance. Figure 1. The below graphs show the average ringing in the ears after participants in a study attended different concerts. The effects were cumulative; so the ringing lasted longer after attending each concert. The horizontal line shows the mean hours of ringing after each concert, while the circles show the data points used to calculate the mean for each concert. TO 50 peo 4. und Butun 8 8 8 Ringing tours Hitit 10. Don Academy Concert Concert OK 10. The mean hours of ringing increase after each successive concert a participant attends is shown by the blue trend line. Focusing on the means and the distribution of scores around the mean for each concert, which of the following are TRUE about the graph on the RIGHT. (select all that apply) The hours of ringing in the ears had a similar distribution after each concert. The deviations from the mean of each concert are homoskedastic. The sample of study participants attending each concert is small. The hours of ringing in the ears increases on average after each successive concert a participant attends. The deviations from the mean of each concert show heterogeneity of variance

Step by Step Solution

There are 3 Steps involved in it

1 Expert Approved Answer
Step: 1 Unlock blur-text-image
Question Has Been Solved by an Expert!

Get step-by-step solutions from verified subject matter experts

Step: 2 Unlock
Step: 3 Unlock

Students Have Also Explored These Related General Management Questions!