

Question: (Figure 1) The figure shows angular position versus time graphs for six different objects. Figure ( < 1 of 1 Part B Rank these
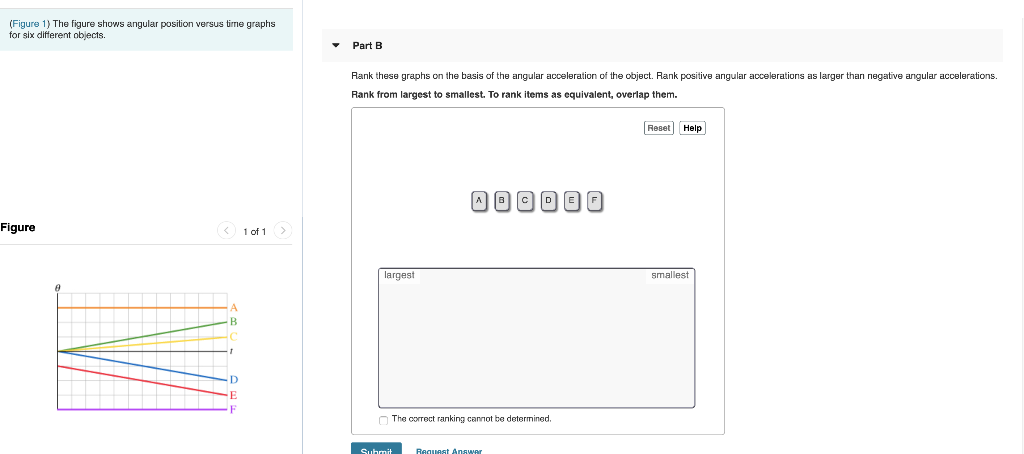
(Figure 1) The figure shows angular position versus time graphs for six different objects. Figure ( < 1 of 1 Part B Rank these graphs on the basis of the angular acceleration of the object. Rank positive angular accelerations as larger than negative angular accelerations. Rank from largest to smallest. To rank items as equivalent, overlap them. largest ABODEA The correct ranking cannot be determined. Submit Request Answer Reset Help smallest
Step by Step Solution
3.36 Rating (149 Votes )
There are 3 Steps involved in it
The expression for angular acceleration is dw dt In the graph the... View full answer

Get step-by-step solutions from verified subject matter experts