

Question: Figure 1 : The graph for Question 3 . Nodes on the left are supply nodes, with the numbers inside indicating the supply. Nodes on
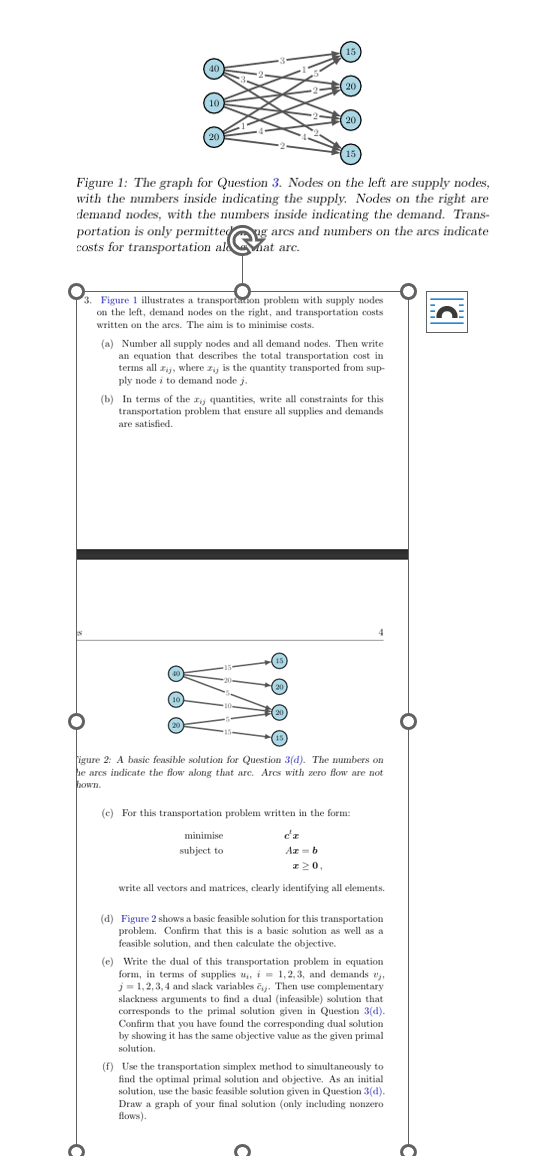
Figure : The graph for Question Nodes on the left are supply nodes,
with the numbers inside indicating the supply. Nodes on the right are
demand nodes, with the numbers inside indicating the demand. Trans
portation is only permitted ares and numbers on the arcs indicate
costs for transportation al Shat arc.
Figure illustrates a transportation problem with supply nodes
on the left, demand nodes on the right, and transportation costs
written on the arcs. The aim is to minimise costs.
a Number all supply nodes and all demand nodes. Then write
an equation that describes the total transportation cost in
terms all where is the quantity transported from sup
ply node to demand node
b In terms of the quantities, write all constraints for this
transportation problem that ensure all supplies and demands
are satisfied.
igure : A basic feasible solution for Question d The numbers on
be arcs indicate the flow along that arc. Arcs with zero flow are not
bown.
c For this transportation problem written in the form:
minimise
subject
write all vectors and matrices, clearly identifying all elements.
d Figure shows a basic feasible solution for this transportation
problem. Confirm that this is a basic solution as well as a
feasible solution, and then calculate the objective.
e Write the dual of this transportation problem in equation
form, in terms of supplies and demands
and slack variables Then use complementary
slackness arguments to find a dual infeasible solution that
corresponds to the primal solution given in Question d
Confirm that you have found the corresponding dual solution
by showing it has the same objective value as the given primal
solution.
f Use the transportation simplex method to simultancously to
find the optimal primal solution and objective. As an initial
solution, use the basic feasible solution given in Question d
Draw a graph of your final solution only including nonzero
flows
Step by Step Solution
There are 3 Steps involved in it
1 Expert Approved Answer
Step: 1 Unlock

Question Has Been Solved by an Expert!
Get step-by-step solutions from verified subject matter experts
Step: 2 Unlock
Step: 3 Unlock