

Question: Figure 11-1 Real GDP per hour worked, YA Production function, Production function, Production function, $40 60 Capital per hour worked, 28. Refer to Figure 11-1.
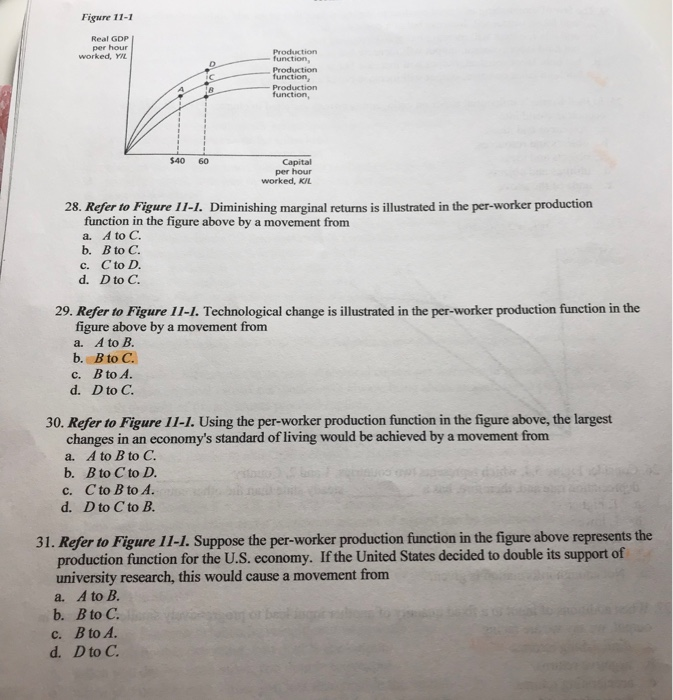
Figure 11-1 Real GDP per hour worked, YA Production function, Production function, Production function, $40 60 Capital per hour worked, 28. Refer to Figure 11-1. Diminishing marginal returns is illustrated in the per-worker production function in the figure above by a movement from a. A to C b. B to C. c. Cto D. d. D to C. 29. Refer to Figure 11-1. Technological change is illustrated in the per-worker production function in the figure above by a movement from a. A to B. b. B to C. c. B to A. d. D to C. 30. Refer to Figure 11-1. Using the per-worker production function in the figure above, the largest changes in an economy's standard of living would be achieved by a movement from a. A to B to C. b. B to C to D. c. C to B to A. d. Dto C to B. 31. Refer to Figure 11-1. Suppose the per-worker production function in the figure above represents the production function for the U.S. economy. If the United States decided to double its support of university research, this would cause a movement from a. A to B. b. B to C. c. B to A. d. D to C. Homework#3 32. Refer to Figure 11-1. Within a country, the impact of wars and revolutions and their subsequent destruction of capital is reflected in the per-worker production function in the figure above by movement from a. A to B. b. B to C. c. B to A. d. Cto A
Step by Step Solution
There are 3 Steps involved in it

Get step-by-step solutions from verified subject matter experts