

Question: Figure 2 7 - 5 . The figure shows a utility function for Dexter. Figure 2 7 - 5 . The figure shows a utility
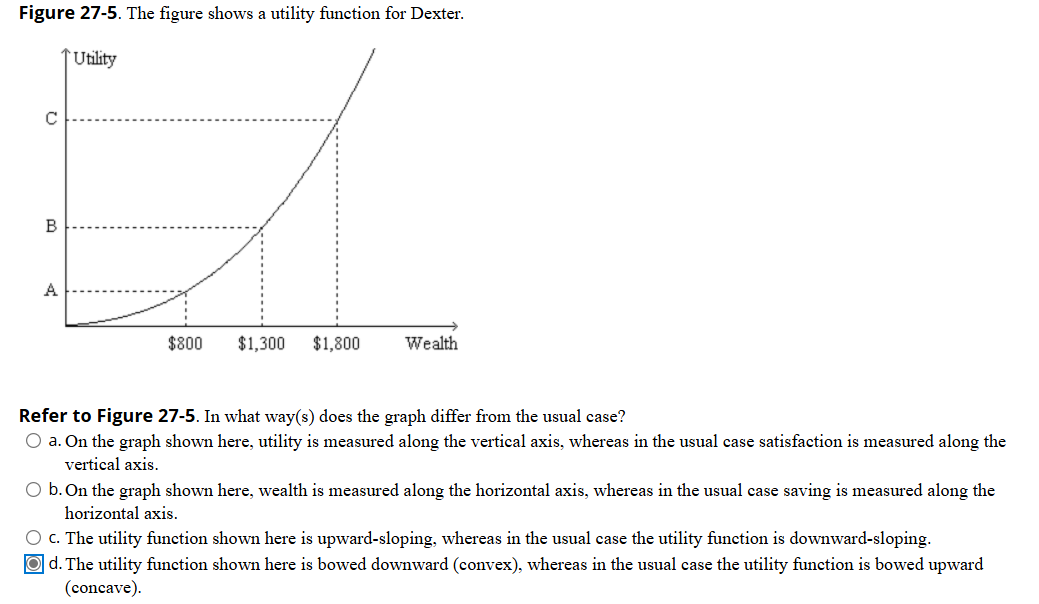
Figure The figure shows a utility function for Dexter. Figure The figure shows a utility function for Dexter.
Refer to Figure In what ways does the graph differ from the usual case?
a On the graph shown here, utility is measured along the vertical axis, whereas in the usual case satisfaction is measured along the vertical axis.
b On the graph shown here, wealth is measured along the horizontal axis, whereas in the usual case saving is measured along the horizontal axis.
c The utility function shown here is upwardsloping, whereas in the usual case the utility function is downwardsloping.
d The utility function shown here is bowed downward convex whereas in the usual case the utility function is bowed upward concave
Step by Step Solution
There are 3 Steps involved in it
1 Expert Approved Answer
Step: 1 Unlock

Question Has Been Solved by an Expert!
Get step-by-step solutions from verified subject matter experts
Step: 2 Unlock
Step: 3 Unlock