

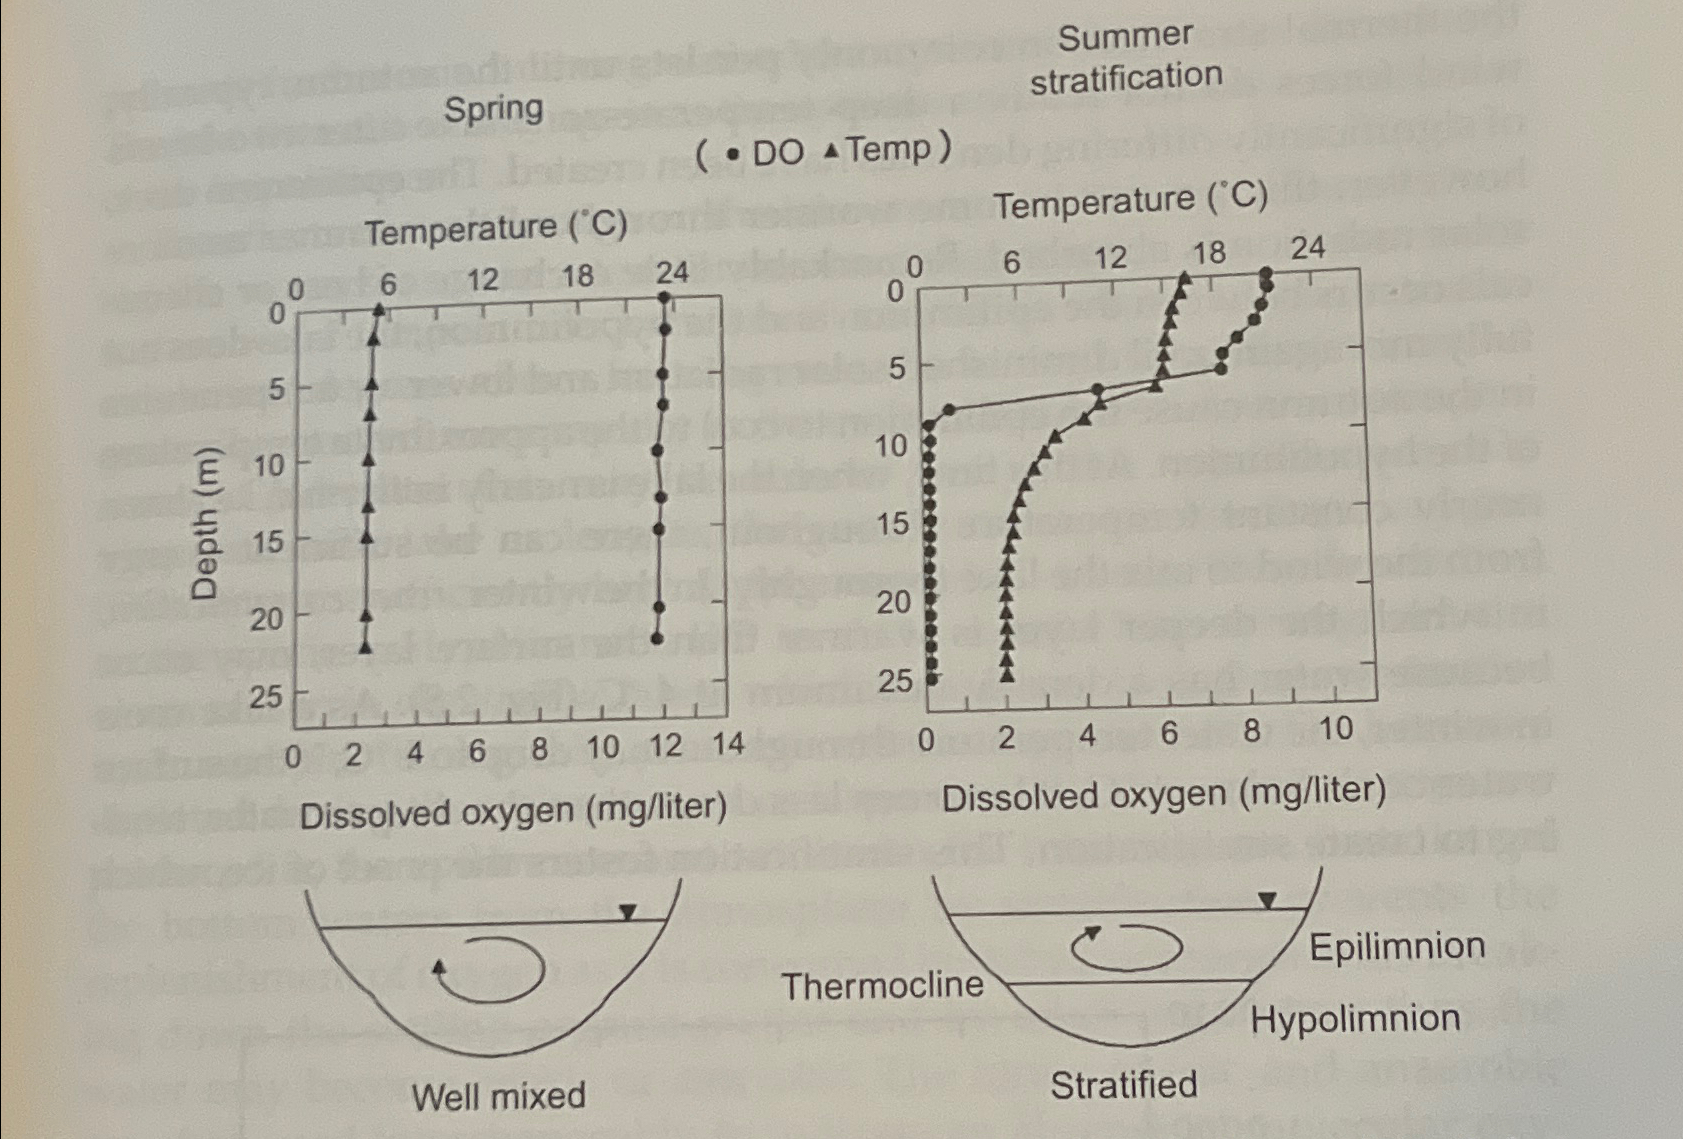
Question: Figure 2 . 7 shows the D O and temperature profiles in Upper Mystic Lake on the Aberjona Watershed in eastern Massachusetts on September 3
Figure shows the and temperature profiles in Upper Mystic Lake on the Aberjona Watershed in eastern Massachusetts on September
a Estimate the minimum possible flux density of downward Fickian oxygen transport through the thermocline at a depth of approximately m
b How could the actual flux density be greater than this estimate, assuming the gradient data are accurate?
c If oxygen is being transported downward, why is there essentially no oxygen in the hypolimnion?
Summer
Spring stratification DO Temp
Temperature
Temperature
Dissolved oxygen mgliter
Dissolved oxygen mgliter
Step by Step Solution
There are 3 Steps involved in it
1 Expert Approved Answer
Step: 1 Unlock

Question Has Been Solved by an Expert!
Get step-by-step solutions from verified subject matter experts
Step: 2 Unlock
Step: 3 Unlock