

Question: Figure 2 below is the sensitivity analysis you obtained after solving the model. Constraints Final Shadow Constraint Allowable Allowable Cell Name Value Price R.H. Side
Figure 2 below is the sensitivity analysis you obtained after solving the model.
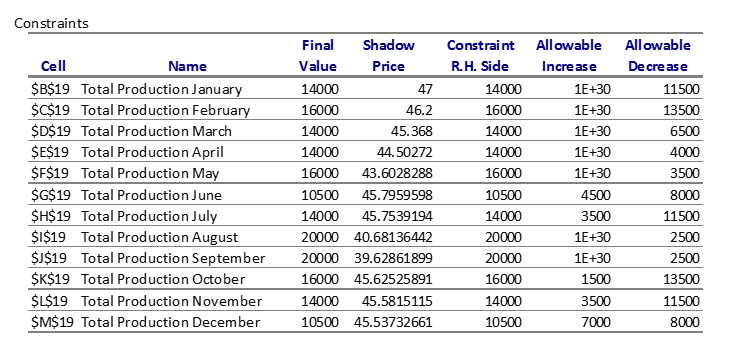
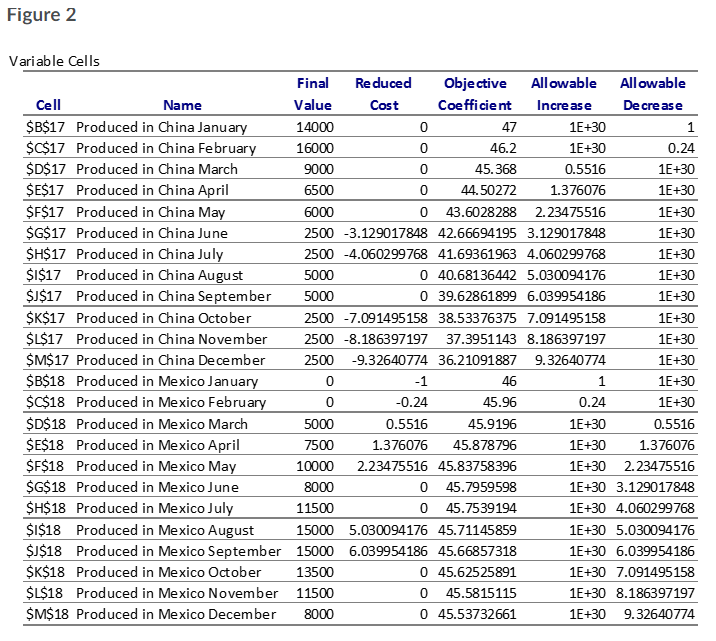
Constraints Final Shadow Constraint Allowable Allowable Cell Name Value Price R.H. Side Increase De crease $B$19 Total Production January 14000 47 14000 1E+30 11500 $C$19 Total Production February 16000 46.2 16000 1E+30 13500 $D$19 Total Production March 14000 45.368 14000 1E+30 6500 SES19 Total Production April 14000 44.50272 14000 1E+30 4000 SF$19 Total Production May 16000 43.6028288 16000 1E+30 3500 $G$19 Total Production June 10500 45.7959598 10500 4500 8000 SH$19 Total Production July 14000 45.7539194 14000 3500 11500 SI$19 Total Production August 20000 40.68136442 20000 1E+30 2500 $J$19 Total Production September 20000 39.62861899 20000 1E+30 2500 SK$19 Total Production October 16000 45.62525891 16000 1500 13500 $L$19 Total Production November 14000 45.5815115 14000 3500 11500 $M$19 Total Production December 10500 45.53732661 10500 7000 8000Figure 2 Variable Cells Final Reduced Objective Allowable Allowable Cell Name Value Cost Coefficient Increase De crease $B$17 Produced in China January 14000 0 47 1E+30 1 $C$17 Produced in China February 16000 0 46.2 1E+30 0.24 $D$17 Produced in China March 9000 0 45.368 0.5516 1E+30 $E$17 Produced in China April 6500 0 44.50272 1.376076 1E+30 $F$17 Produced in China May 6000 0 43.6028288 2.23475516 1E+30 $G$17 Produced in China June 2500 -3.129017848 42.66694195 3.129017848 1E+30 $H$17 Produced in China July 2500 -4.060299768 41.69361963 4.060299768 1E+30 $1$17 Produced in China August 5000 0 40.68136442 5.030094176 1E+30 $J$17 Produced in China September 5000 0 39.62861899 6.039954186 1E+30 $K$17 Produced in China October 2500 -7.091495158 38.53376375 7.091495158 1E+30 $L$17 Produced in China November 2500 -8.186397197 37.3951143 8.186397197 1E+30 $M$17 Produced in China December 2500 -9.32640774 36.21091887 9.32640774 1E+30 $B$18 Produced in Mexico January 0 -1 46 1 1E+30 $C$18 Produced in Mexico February 0 -0.24 45.96 0.24 1E+30 $D$18 Produced in Mexico March 5000 0.5516 45.9196 1E+30 0.5516 $E$18 Produced in Mexico April 7500 1.376076 45.878796 1E+30 1.376076 $F$18 Produced in Mexico May 10000 2.23475516 45.83758396 1E+30 2.23475516 $G$18 Produced in Mexico June 8000 0 45.7959598 1E+30 3.129017848 $H$18 Produced in Mexico July 11500 0 45.7539194 1E+30 4.060299768 $1$18 Produced in Mexico August 15000 5.030094176 45.71145859 1E+30 5.030094176 $J$18 Produced in Mexico September 15000 6.039954186 45.66857318 1E+30 6.039954186 $K$18 Produced in Mexico October 13500 0 45.62525891 1E+30 7.091495158 $L$18 Produced in Mexico November 11500 0 45.5815115 1E+30 8.186397197 $M$18 Produced in Mexico December 8000 0 45.53732661 1E+30 9.32640774
Step by Step Solution
There are 3 Steps involved in it

Get step-by-step solutions from verified subject matter experts